
Job quality profiles reveal division: men clearly more often in “good jobs” than women
5.3.2021
Kuva: Shutterstock
There are considerable differences in the quality of working life among wage and salary earners. The segregation by gender in working conditions is also particularly striking, shows the profiling of the results of the 2018 Quality of Work Life Survey.
The quality of working life is a key topic in the development of working life and in research. In Finland, the aim has been to invest in it considerably. The objective of the Working Life 2020 project was to make Finnish working life the best in Europe by 2020. The current Government Programme aims to make Finland's well-being at work the best in the world by 2030.
Working conditions are a complex comprising of many different components. Even in the same jobs, some of these factors may be in excellent order while at the same time there are obvious problems in some of them.
What combinations may arise from the components of working conditions? Is there polarisation towards clearly good and bad jobs visible in the Finnish wage and salary earner community, or are working conditions rather a multifaceted phenomenon?
We started to investigate the matter by outlining different job quality profiles from the data of the 2018 Quality of Work Life Survey in a similar way as Eurofound has done with the data of the European Working Conditions Survey 2017 (Eurofound, 2017). In this article we examine how different work environment factors are combined into different job quality profiles and how wage and salary earners are divided into these different types of groups with diverse profiles.
Five job quality profiles
Several international tools have been built to measure the quality of work and working conditions (UNECE, OECD, ILO, Eurofound). Although their priorities and purpose of use differ slightly, several common features of “good jobs” can be identified from them.
Here we approach the definition of different employee groups by primarily using the Eurofound Job Quality model for measuring quality of working conditions. It consists of seven indices describing the quality of work: Skills and Discretion, Social Environment, Working Time Quality, Physical Environment, Job Prospects, Earnings and Work Intensity.
However, in our own definition of job quality profiles – with the data of the Quality of Work Life Survey and using the factor analysis (see the methodological box below) – we settled on only five of the above-mentioned components:
The Skills and Discretion factor consists of the variables of the Quality of Work Life Survey that measure possibilities for influencing different areas of work, for development and learning at work and eg. appreciation gained by own professional skills.
In contrast, the Social Environment factor measures relations between co-workers and supervisors, appreciation received from the work community, and experiences of harassment and bullying.
The Flexibility of Working Time factor includes variables describing possibilities for flexibility in working hours, influencing working time and timing of holidays, and the need for flexibility from the requirements of supervisors or tasks.
The Physical Environment consists of variables used to study various physical disadvantages in the work environment (e.g. noise, heavy lifting and indoor air problems). It also measures the perceived risk of infectious diseases, strain injuries and accidents at work, as well as the experienced physical strain of work.
The fifth factor, Work Intensity, measures the time pressure experienced at work and the mental strain of work.
With the help of the grouping analysis made with these factors we found in the data of the Quality of Work Life Survey five wage and salary earner groups that are identifiable and describe the phenomena of working life, which we named according to their characteristics as Good jobs, Decent manual jobs, Jobs spoiled by time pressure, Heavy manual jobs and Burdensome jobs.
Figure 1 shows the loading of the measured factors in different job quality profile groups. The value 0 in the horizontal axis describes the average of the 2018 Quality of Work Life Survey for the component in question. A factor having received a positive value shows that the component in question is realised better than average in the group.
Correspondingly, a factor having received a negative value indicates that the component in question is worse than average in the group. The distance of the factor from the 0 axis indicates the magnitude of the average deviation.
Figure 1. Distance of the factors describing the quality of working conditions and the average in different job quality profiles

Source: Statistics Finland, Quality of Work Life Survey 2018
Figure 2: Shares of wage and salary earners in different job quality profiles

Source: Statistics Finland, Quality of Work Life Survey 2018
Figure 3: Shares of female wage and salary earners in different job quality profiles

Source: Statistics Finland, Quality of Work Life Survey 2018
Figure 4. Shares of male wage and salary earners in different job quality profiles

Source: Statistics Finland, Quality of Work Life Survey 2018
In Figure 5, the shares of job quality profiles are also presented according to other background variables.
Figure 5. Share of wage and salary earners classified in different job quality profiles by sex, age, education, socio-economic group, employer sector and occupation (click the chart larger, link opens to a new tab)
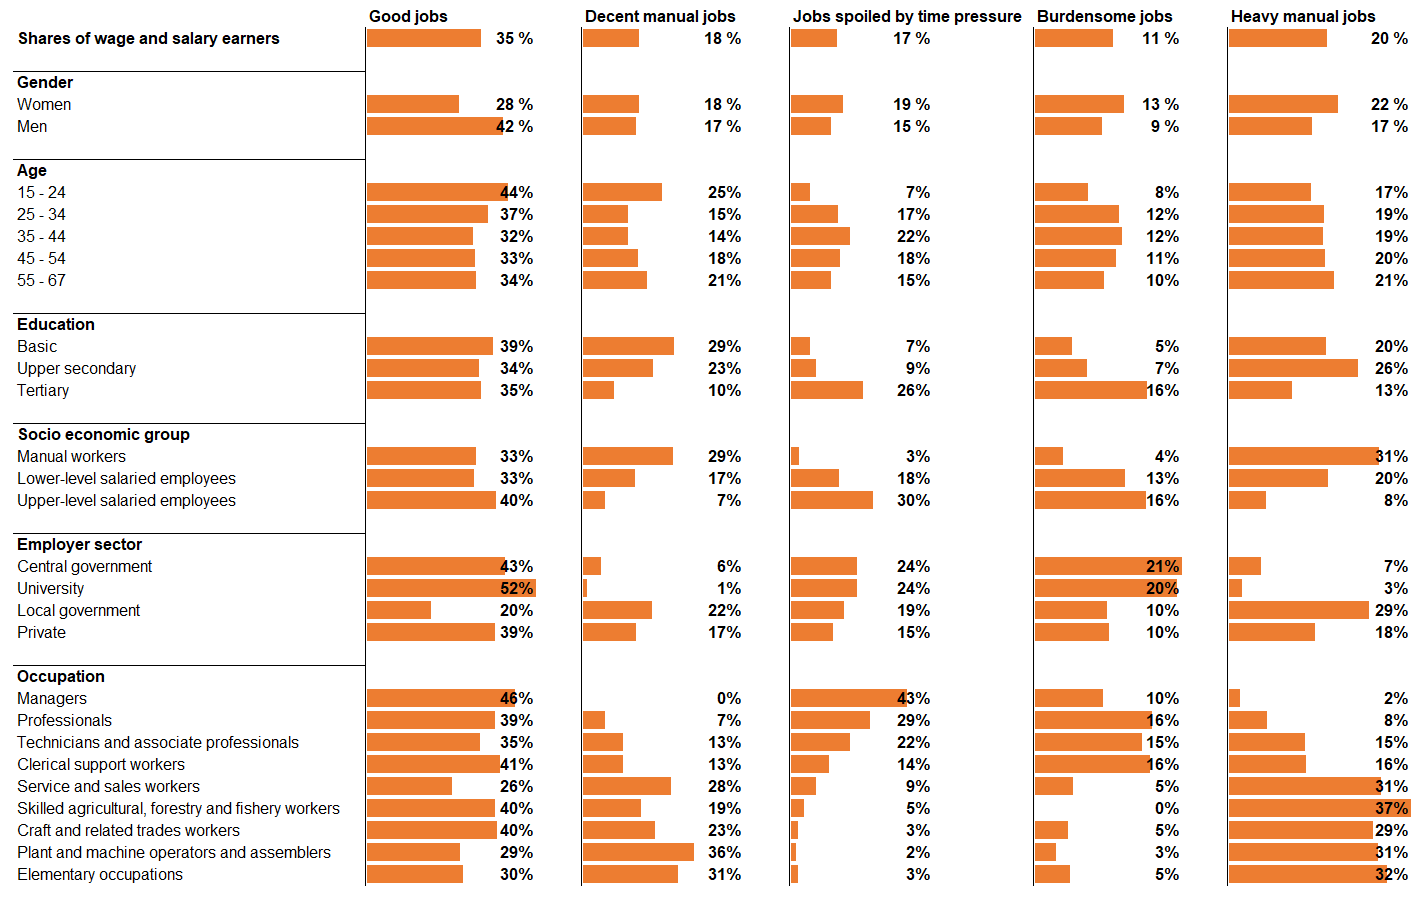
Source: Quality of Work Life Survey 2018, *Classification of Occupations 2010, 1-digit level
Good jobs
The first job quality profile is called Good jobs. As the name indicates, all the measured quality factors of working conditions reach well above average. This is the largest group and covers over one-third of wage and salary earners (35%).
Those working in good jobs are mostly satisfied with various aspects of work, development opportunities, appreciation of professional skills and organisation of work. They have extensive possibilities to influence various components of work. Work engagement is strong and the development possibilities are mostly good.
Working hours are very flexible in good jobs. There are few physical disadvantages in work. The work community has a good atmosphere and social support and there are hardly any conflicts. Good jobs do not impose much physical or mental burden.
The group has more men (60%) than women (40%). The educational structure corresponds to the wage and salary earner community's average: 45 per cent have tertiary level degrees, 43 per cent upper secondary qualifications and 11 per cent at most basic level education. The socio-economic structure also corresponds to that of the wage and salary earner community.
In all, the group has a versatile structure and consists of wage and salary earners in many different occupations. However, managers, professionals in various fields, clerical support workers and craft and related trades workers are emphasised in the occupational groups. The group includes software designers, supervisors, project managers, carpenters, salespersons and waiters. The spectrum of occupations is thus very wide. The group of good jobs includes people of all ages.
Good jobs form the largest single group in all employer sectors (39% to 52%) apart from the local government sector, where 20 per cent of wage and salary earners belong to this group.
Decent manual jobs
The Decent manual jobs group covers 18 per cent of wage and salary earners. In these jobs the factor of Working Time Flexibility scores the weakest in the groups. The Skills and Discretion and Physical Environment factors are also slightly weaker than average. By contrast, the factors of Social Environment and Work Intensity are positively loaded.
Decent manual jobs do not offer much chance to influence different aspects of work. The development possibilities are also slightly weaker than average. Working hours are less flexible than in other groups: as many as 85 per cent have fixed starting and finishing times, while the corresponding average for all wage and salary earners is 35 per cent. The work is physically strenuous.
Despite these limitations, more employees than average feel work engagement, consider the work community’s atmosphere and team spirit to be open and receive social support from both co-workers and supervisors. There are very few conflicts in work communities. Time pressure is not very significant, and the work is well organised.
The gender distribution of the group is fairly even (51% women, 49% men). The educational level is the lowest among the groups: 74 per cent have at most upper secondary level qualifications. One-half of the group members are workers and over one-third (37%) lower-level salaried employees.
The group consists of many process and transport workers, service and sales workers, and care workers, such as practical nurses. Young adults at the beginning of their careers and elderly wage and salary earners aged at least 55 are emphasised in the age structure.
Decent manual jobs cover over one-fifth (22%) of the work in the local government sector, and they are also plentiful in the private sector (17%). There are very few decent manual jobs in central government and universities.
Jobs spoiled by time pressure
“Jobs spoiled by time pressure” are done by 17 per cent of wage and salary earners. In these jobs many elements are in place and nearly all measured factors receive a positive loading – apart from Work Intensity, which receives a weaker average than in any other group and thus tells about the time pressure and mental strain of these jobs.
The time pressure greatly influences how work is perceived in this group. The work offers opportunities for influencing the content of work and the development of the organisation's activities, for example, but not much the pace of work. Work engagement is experienced a lot.
In these jobs, possibilities to develop at work are seen as relatively good. Working hours are flexible and work is physically light. By contrast, the mental burden is very heavy. A clear majority feel that there are too many tasks and that they do not have time to do them as well as they would like to.
The organisation of work leaves something to be desired. Relationships with supervisors and co-workers are in many respects similar to the average for wage and salary earners.
There are more women (56%) than men (44%) in jobs spoiled by time pressure. The educational level is the highest among the groups, as many as 72 per cent have some tertiary level degree and the majority (54%) are upper-level salaried employees. The number of lower-level salaried employees is also relatively high (41%), but the number of workers is very low (5%).
The group comprises relatively many managers and experts and professionals in various fields, such as sales, marketing and project managers, software designers, IT experts, social workers and teachers.
People aged 35 to 44 are emphasised in the age structure. Jobs spoiled by time pressure are held the least by the youngest and oldest wage and salary earners.
Jobs spoiled by time pressure can be found widely in all employer sectors. However, central government (24%) and universities (24%) have most of them in relative terms.
Burdensome jobs
The group of burdensome jobs is smallest in size (11%) in this grouping. The factors of Physical Environment and Working Time Flexibility receive better than average values in this group, but the factor of Work Intensity is clearly worse than the average. The factors of Skills and Discretion and Social Environment get the worst points from the groups.
There is little chance of influencing different aspects of work in burdensome jobs. Dissatisfaction is felt about the organisation of work and the experiences of work engagement are minor. Most feel that it is important to develop at work, but the possibilities for doing so are poor.
However, working hours are flexible. The work is physically light but at the same time mentally very strenuous. Social relationships at the workplace do not work and there are more conflicts in the work communities than in other groups.
The group is female-dominated (57%). Two out of three (66%) have tertiary level degrees and nearly one-third (30%) have upper secondary level qualifications. The group consists mainly of upper and lower-level salaried employees.
The group has a wide range of professionals and associate professionals, as well as clerical support workers. Examples of occupations include social workers, software designers, sales and project managers, nurses, teachers and secretaries. There are slightly fewer young and aged wage and salary earners in this group than in wage and salary earners on average.
In relative terms, most burdensome jobs are found in central government (21%) and universities (20%). These jobs cover around 10 per cent of both local government and private sector jobs.
Heavy manual jobs
As many as one-fifth (20%) of wage and salary earners are classified under the last group “heavy manual jobs”, where all the job quality factors we measured are worse than average. Thus, work is burdensome in many different areas, but the factor of Physical Environment in particular scores the weakest points of the groups.
In its socio-economic structure, the group is similar to the group of decent manual jobs, where the emphasis is also on manual and physically heavy work. However, these two groups differ clearly from each other in the experience of working conditions, especially in terms of relations in the work community, and time pressure and mental strain. In heavy manual jobs, the mental load is clearly bigger than in decent manual jobs.
Few of the group members can have a say in different aspects of their work. Only a few feel that they have good opportunities to participate in the development of the work organisation's activities or develop in their own work. Work engagement is experienced less than average. There is not much flexibility in working hours.
The atmosphere of the work community is often seen as poor and more conflicts occur in the work community than average. People are dissatisfied with the organisation of work. Work is both mentally and particularly physically strenuous.
The group is female-dominated (56%). The majority (59%) have upper secondary level qualifications and just under one-third (30%) tertiary level degrees. The group consists mainly of workers and lower-level salaried employees (88%). Service and sales workers, as well as process and transport workers are over-represented.
The group includes salespersons, cleaners, warehouse workers and practical nurses, but also kindergarten teachers and nurses. The group largely consists of wage and salary earners of all ages.
Heavy manual jobs form the largest single group in the local government sector (29%). In addition, relatively many of these jobs are in the private sector (18%), but very few in the central government sector (3%) and universities (7%).
Job insecurity and atypical employment relationships
When building the statistical model behind this grouping, we initially included the factor of job insecurity but left it out after a few trials (see the methodological section). We decided to examine insecurity and the share of part-time and fixed-term employment relationships separately in different job quality profiles.
Job insecurity manifests in different ways in different groups. In heavy manual jobs and burdensome jobs, all the insecurities measured here are feared more than average; the fears of unemployment and dismissal become particularly evident in burdensome jobs. (Table 1)
In good jobs and decent manual jobs, job insecurity is correspondingly felt less than average.
In jobs spoiled by time pressure, only the fear of unforeseeable changes and the fear of not learning to use new technology sufficiently well stand out.
| Good jobs | Decent manual jobs |
Jobs spoiled by time pressure |
Heavy manual jobs |
Burdensome jobs |
All wage and salary earners |
|
|---|---|---|---|---|---|---|
| Regards dismissal as a threat at work | 9 % | 10 % | 15 % | 22 % | 27 % | 15 % |
| Regards unemployment as a threat |
12 % | 12 % | 17 % | 22 % | 32 % | 17 % |
| Regards loss of work capacity as a threat at work |
12 % | 21 % | 17 % | 50 % | 25 % | 23 % |
| Regards unforeseeable changes as a threat at work |
34 % | 30 % | 53 % | 67 % | 63 % | 46 % |
| Fears that will not learn to use new technology sufficiently well |
7 % | 10 % | 15 % | 20 % | 17 % | 12 % |
| Uncertainty of the work situation burdens mentally (totally true or somewhat true) * |
17 % | 21 % | 31 % | 46 % | 46 % | 31 % |
Source: Statistics Finland, Quality of Work Life Survey 2018
The prevalence of part-time or fixed-term employment relationships does not vary much between the groups. However, clearly fewer (6%) work part-time in jobs spoiled by time pressure and more (16%) in decent manual jobs than in the other groups (Table 2).
The type of employment relationship often has an effect, for example, on the experience of financial uncertainty, but measured in this way, it seems to be reflected surprisingly little in the quality of work itself.
| Good jobs | Decent manual jobs |
Jobs spoiled by time pressure |
Heavy manual jobs |
Burdensome jobs |
All wage and salary earners |
|
|---|---|---|---|---|---|---|
| Part-time employment relationship | 12 % | 16 % | 6 % | 14 % | 12 % | 12 % |
| Fixed-term employment relationship | 14 % | 17 % | 11 % | 15 % | 14 % | 14 % |
Source: Statistics Finland, Quality of Work Life Survey 2018
Earnings are felt to be most fair in good jobs
It was also difficult to form a uniform factor describing earnings and their fairness. We decided to examine the gross monthly pay reported by full-time wage and salary earners in the Quality of Work Life Survey and the perceived fairness of pay relative to labour input in different job quality profiles.
The earnings level is highest in jobs spoiled by time pressure. The next highest earnings are paid in good and burdensome jobs. The earnings level remains weakest in heavy manual and decent jobs. (Table 3)
| Good jobs | Decent manual jobs | Jobs spoiled by time pressure | Heavy manual jobs | Burdensome jobs | All wage and salary earners | |
|---|---|---|---|---|---|---|
| Average monthly income in main job (own report, gross) | EUR 3101–3300 per month |
EUR 2701–2900 per month |
EUR 3501–3700 per month |
EUR 2701–2900 per month |
EUR 3101–3300 per month |
EUR 2901–3100 per month |
| Considers pay to be very fair | 34 % | 19 % | 24 % | 8 % | 14 % | 22 % |
| Regards pay at least to some extent as more important than content of work | 35 % | 49 % | 26 % | 51 % | 31 % | 39 % |
Source: Statistics Finland, Quality of Work Life Survey 2018
Pay is considered very fair most often in good jobs. Slightly more people than average also think this in jobs spoiled by time pressure. It is, however, interesting that pay satisfaction falls well short of good jobs in this highest earnings group. The size of earnings is thus not directly linked to how fair the pay is considered to be, but on the other hand it is a question of pay relative to labour input.
Other groups are below average in pay satisfaction, i.e. heavy manual and decent jobs as well as burdensome jobs. However, the majority of wage and salary earners feel their pay is at least fairly fair in all groups. Roughly one-half consider their pay to be very or fairly unequal only in heavy manual jobs.
Finnish working life is top in Europe – but pressed for time
This analysis was based on a similar analysis by Eurofound, which ended up with five different job quality profiles, using the 2015 data of the European Quality of Work Life Survey. However, these groups deviated quite considerably from our grouping, which was generated from the data of Statistics Finland's Quality of Work Life Survey describing working conditions only in Finland.
The results of Eurofound describe working conditions relative to the European average, while in our own comparison the groups are formed relative to the Finnish national average. Despite the different group structures, we can find similarities in the results.
Eurofound’s comparison shows that Finnish working life is one of the best in Europe. In Finland, 37 per cent of employed persons belonged to the high flying group mainly comparable to our own group of good jobs, while the average for the EU28 was 22 per cent. At the European level, an average of 19 per cent of employed persons belonged to the other extreme, or the poor quality group, while in Finland the figure was only five per cent, which is correspondingly the smallest share in the EU countries.
On the other hand, there were clearly more employed persons (21%) in Finland in the under pressure group than on average in the EU countries (13%), which mainly corresponds to the group of jobs spoiled by time pressure in our classification. In these high-flying and under pressure groups with a high representation of Finnish employed persons, time pressure is a distinct stress factor. This confirms the results that time pressure seems to be a particular problem in Finnish working life (Sutela, Pärnänen, Keyriläinen 2019, 139).
In the Eurofound results the active manual group mainly corresponds to our decent manual jobs group, where Finland (24%) is more or less on average with the EU28 (22%).
The fifth group, “smooth running”, produced in the Eurofound analysis covered 25% of the EU28 workforce. In Finland, only 13 per cent of employed persons belonged to the group and there is no direct equivalent for this group in the profiling based on the Finnish Quality of Work Life Survey. At European level, the group consists largely of part-time employed persons, for whom the flexibility of working hours and social support were realised well, but who had poorer development and influencing possibilities, and whose earnings level remained low.
In Finland, part-time work is still relatively scarce by international comparison and in our data part-time or fixed-term work did not much separate the groups.
In the European comparison, segregation by gender in the quality of work is not visible to the same extent as in our classification concerning Finland. There are only slightly more men (23%) in the high flying group than women (20%), and correspondingly, women (21%) were only somewhat more represented than men (18%) in the poor quality profile jobs.
On the other hand, in the data concerning Finland the effect of occupations, education and socio-economic group on the quality of work does not seem to be as large and polarising the working life as much as in the European comparison.
Polarisation, but also a lot of good that could take place in many kinds of jobs
The results give a lot to think about from the viewpoint of developing working life. They show fairly strong polarisation of working conditions. Particularly striking is the gender-specific segregation of working life in this respect as well: men work clearly more often in jobs classified as good according to this model than women.
Roughly speaking, around one half of Finnish employees (good jobs, decent manual jobs) have working conditions more or less in order: the share is around 60 per cent for men and 46 per cent for women. In addition, for roughly every sixth it would be very good if time pressure and mental strain of work did not spoil the whole (women 19%, men 15%).
However, working conditions are very burdensome for nearly one third (i.e. heavy manual jobs, burdensome jobs) as a whole (women 35%, men 26%).
It is, however, noteworthy that there are relatively many good jobs in Finland (26% to 46%) in all 1-digit level occupational groups of the Classification of Occupations (see Figure 5). This indicates that versatile high-quality working conditions are possible in all types of jobs and are not just the exclusive right of some privileged wage and salary earner groups.
This message is important for continuous development of working life. By recognising the problems in each work environment and work community, addressing them and developing the quality of working conditions there should not be any principled obstacles for us all to be able to work in good jobs or at least in decent jobs regardless of our background and tasks. An alternative threat is that the polarisation of working life into good and bad jobs will continue in future.
The grouping we have presented in this article provides a good basis for further examining, for example, the realisation of occupational well-being, job satisfaction and the effects of digitalisation of work in different job quality profiles.
To what extent would further analysis strengthen or alleviate the picture of the polarisation of working conditions? For example, can it be ascertained which of the job quality components are especially strongly connected to experienced well-being at work and would deserve special attention from the perspective of developing working conditions?
The authors work in Statistics Finland's Social Statistics Department.
Methodological description
The job quality profiles formed with the data of the Quality of Work Life Survey were formed with the methods of factor analysis and grouping analysis. The factors we use are based on the indices describing the quality of work formed from the European Working Conditions Survey carried out by the European Foundation for the Improvement of Living and Working Conditions (Eurofound) (see Green & Mostafa 2012). These indices have been used in the classification of wage and salary earner groups with the data of the European Working Conditions Survey for 2015. (Eurofound 2017, 128 to 135)
The Latent class analysis method has been used in the classification of Eurofound. In our own classification we used the so-called two-step clustering analysis. This method is suitable for extensive data and for classifying various scaled data. (Trpkova & Tevdovski 2009, 303)
We formed indices from the variables of the Quality of Work Life Survey by selecting the questions corresponding to the variables used by Eurofound from our own data. We also added other variables from the Quality of Work Life Survey data to the indices at our discretion if and when they serve as indicators for the same dimension.
After this we formed mainly variables with values between 0 to 1, although with our own consideration and to imitate the previous classification we gave some variables a higher weight in the index. Internal consistency of the factors was tested and corrected with the help of the factor analysis.
The reliability of the formed factors was assessed with the Cronbach alfa coefficient. The correlation between the variables of the factors used in the grouping analysis was strong (at its highest r = 0.55) but was clearly below the critical limit (r = 0.9) (Kaasalainen & Saari 2019, 100).
In the Eurofound classification (2017), five job profiles were identified with six factors measuring working conditions and one natural logarithm measuring the size of earnings. We formed six factors with the data of the Quality of Work Life Survey.
We also tried to build a factor describing the fairness and size of earnings with the variables in the Quality of Work Life Survey. We were unable to form a coherent factor with the variables, so we examined separately how earnings and experience of their fairness manifest themselves in the final groups.
The factor that describes job insecurity was also excluded at the end because we found that insecurity is in many respects is an experience cross-sectional to the wage and salary earner population. When the factor of insecurity was included in the grouping a group was formed of persons experiencing insecurity, which did not, however, differ from the average with other factors. Insecurity is strongly present in working life but was not in this case a clear factor distinguishing the quality of work among wage and salary earners.
Many thanks to Senior Statistician Juhani Saari for support and guidance with the research method.
Sources:
Eurofound (2017), Sixth European Working Conditions Survey – Overview report (2017 update), Publications Office of the European Union, Luxembourg. Accessible <https://www.eurofound.europa.eu/sites/default/files/ef_publication/field_ef_document/ef1634en.pdf>
Green, F. & Mostafa, T. (2012) Trends in job quality in Europe, based on 5th European Working Conditions Survey, Eurofound. Accessible < https://www.eurofound.europa.eu/publications/report/2012/working-conditions/trends-in-job-quality-in-Europe >
ILO (2013) Decent Work Indicators – Guidelines for Producers and Users of Statistical and Legal Framework Indicators. ILO manual – second edition, 12/2013. Accessible: https://www.ilo.org/wcmsp5/groups/public/---dgreports/---integration/documents/publication/wcms_229374.pdf
Kaasalainen, K. & Saari, J. (2019) Sport motivation scale- mittarin validiteetti korkeakouluopiskelijoilla ja motivaatioprofiilien erot liikunta-aktiivisuudessa, liikuntapalvelujen koetussa tärkeydessä ja käytössä (in Finnish only) (Validity of the Sport motivation scale indicator for university students and differences in motivation profiles in physical activity, perceived importance and use of physical exercise services). Liikunta & Tiede 56 (2–3), 97–106. Accessible <https://www.lts.fi/media/lts_vertaisarvioidut_tutkimusartikkelit/2019/lt_2-3_19_tutkimusartikkeli-kaasalainen_lowres.pdf>
OECD (2016) How Good is Your Job – Measuring and Assessing Job Quality. Accessible: https://www.oecd.org/statistics/job-quality.htm
Sutela, H. Pärnänen, A. & Keyriläinen, M. (2019) Working life in the digital age - results of the Quality of Work Life Surveys 1977 to 2018. Helsinki. Statistics Finland. Accessible https://www.stat.fi/tup/julkaisut/tiedostot/julkaisuluettelo/ytym_1977 2018_2019_21473_net.pdf
Trpkova, M. & Tevdovski, D. (2009) Twostep cluster analysis: Segmentation of largest companies in Macedonia. In the publication: Challenges for Analysis of the Economy, the Businesses, and Social Progress, Reviewed Articles. 2009, p. 302-318. Accessible <http://eco.u-szeged.hu/download.php?docID=40391>
United Nations Economic Commission for Europe (2015) Handbook of Measuring Quality of Employment – A statistical framework. United Nations. New York and Geneva, 2015 . Accessible: http://www.unece.org/fileadmin/DAM/stats/publications/2015/ECE_CES_40.pdf