

Published: 28 February 2019
Prices of old dwellings in housing companies fell in January
According to Statistics Finland's preliminary data, prices fell by 1.9 per cent in Greater Helsinki and by 3.3 per cent elsewhere in the country from December to January. Of large towns, prices rose only in Vantaa.
Development of prices of old dwellings in housing companies by month, index 2015=100
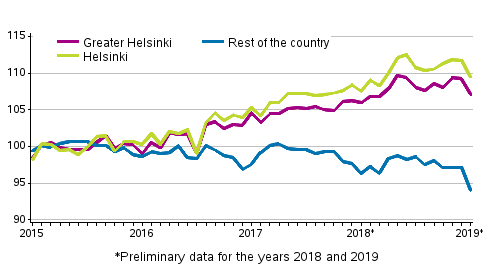
Compared with the corresponding period of the year before, prices rose by slightly over one per cent in Greater Helsinki and fell by good two per cent elsewhere in Finland.
In Helsinki, prices fell by around two per cent in January. Compared with the corresponding period of the year before, prices have nevertheless risen by around two per cent in Helsinki and by 9.5 per cent from 2015.
In the surrounding municipalities, prices remained more or less on the same level compared with December and the corresponding period of the previous year. Compared with 2015, prices have fallen by two per cent.
In January 2019, the average price per square metre of an old dwelling in a housing companies was EUR 4,315 in Helsinki and EUR 2,158 in the surrounding municipalities.
Preliminary data on price changes in January are based on around 400 transactions in Helsinki and on 137 transactions in the surrounding municipalities. The preliminary data comprise, on average, one half of completed transactions in old dwellings in blocks of flats and terraced houses.
Unencumbered average prices per square metre of old dwellings in housing companies, January 2019 1)
| Area | Price, EUR/m� | Index 2015=100 | Monthly change in index, % | Yearly change in index, % |
| Whole country | 2,051 | 100.2 | -2.6 | -0.6 |
| Greater Helsinki | 3,739 | 107.1 | -1.9 | 1.1 |
| Rest of the country (whole country - Greater Helsinki) | 1,563 | 94.0 | -3.3 | -2.4 |
| Satellite municipalities 2) | 2,158 | 98.0 | 0.2 | -0.2 |
| Helsinki | 4,315 | 109.5 | -2.0 | 1.9 |
| Espoo-Kauniainen | 3,367 | 102.2 | -3.5 | -0.1 |
| Vantaa | 2,815 | 105.2 | 1.2 | -0.2 |
| Tampere | 2,383 | 100.7 | -4.7 | -2.9 |
| Turku 3) | 2,039 | 105.9 | -0.0 | 9.7 |
| Oulu | 1,825 | 97.8 | -7.4 | -4.5 |
2) Satellite municipalities = Hyvink��, J�rvenp��, Kerava, Kirkkonummi, Nurmij�rvi, Riihim�ki, Sipoo, Tuusula and Vihti
3) Transactions at a lower price than the general price level were made in Turku in January 2018.
When the monthly statistics on prices of dwellings in housing companies are published, they cover approximately 50 per cent of all transactions made in the latest statistical reference month. The monthly data become revised during the following months so that the final data for the year are published in the release concerning the first quarter of the following year. Further information about data revisions can be found in separate tables. It is not recommended to use the latest month’s number of transactions when describing the activeness of trading.
Source: Prices of dwellings in housing companies, Statistics Finland
Inquiries: Petri Kettunen 029 551 3558, Elina Vuorio 029 551 3385, asuminen.hinnat@stat.fi
Director in charge: Mari Yl�-Jarkko
Publication in pdf-format (321.2 kB)
- Tables
-
Tables in databases
Pick the data you need into tables, view the data as graphs, or download the data for your use.
Appendix tables
- Appendix table 1. Unencumbered average prices per square metre of old blocks of flats, January 2019 1) (28.2.2019)
- Appendix table 2. Unencumbered average prices per square metre of old terraced houses, January 2019 1) (28.2.2019)
- Appendix table 3. Number of known transactions of old dwellings in housing companies in the early part of the year (28.2.2019)
- Quality descriptions
- Revisions in these statistics
-
- Revisions in these statistics (28.2.2019)
Updated 28.2.2019
Official Statistics of Finland (OSF):
Prices of dwellings in housing companies [e-publication].
ISSN=2323-8801. January 2019. Helsinki: Statistics Finland [referred: 18.7.2024].
Access method: http://www.stat.fi/til/ashi/2019/01/ashi_2019_01_2019-02-28_tie_001_en.html