

Published: 27 August 2021
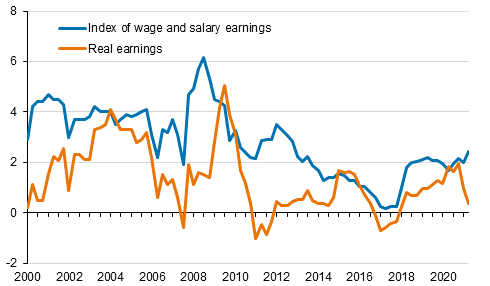
Wage and salary earners’ earnings for regular working hours rose by 2.4 percent in April-June
According to Statistics Finland’s preliminary data, the index of wage and salary earnings, which measures the rise in the nominal earnings of full-time wage and salary earners, rose by 2.4 per cent in April to July 2021 when compared with the respective period in 2020. Real earnings rose by 0.4 per cent compared to the second quarter of the previous year. Due to the accelerated rise in consumer prices, the growth in real earnings slowed down at the beginning of 2021.
Index of wage and salary earnings and real earnings 2000/1 to 2021/2, annual change percentage
According to Statistics Finland’s preliminary data, the nominal earnings of full-time wage and salary earners rose from April to June 2021 to the corresponding period in 2021 by 2.2 per cent in the private sector, by 2.5 per cent in the central government sector and by 3.4 per cent in the local government sector.
The index of regular earnings increased by 2.4 per cent in April to July
The index of regular earnings of full-time wage and salary earners rose by 2.4 per cent in April to June 2021 when compared with the respective period in 2020. The growth amounted to 2.2 per cent in the private sector, to 2.5 per cent in the central government sector, and to 3.4 per cent in the local government sector.
The index for regular earnings describes the permanent change in earnings better than the index of wage and salary earnings because it does not take into account performance-based bonuses and non-recurring items included in collective agreements. The figure shows the development of the index of wage and salary earnings (ATI) of all wage and salary earners and the index for regular earnings (SANI)in 2015 to 2021. The examination ends in the last published quarter, that is, the second quarter of 2021.
Index of wage and salary earnings and the index for regular earnings 2015=100
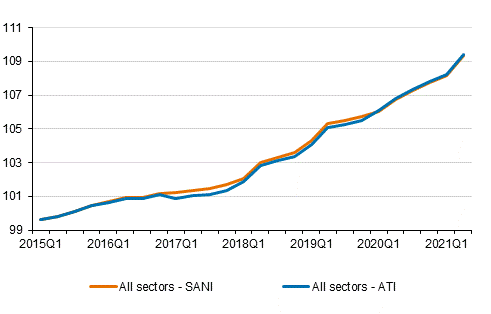
In addition to performance-based bonuses, the development of the index of wage and salary earnings is influenced by non-recurring items included in collective agreements. Public sector holiday bonuses were cut by 30 per cent in 2017 to 2019. This is also visible in the development of the index of wage and salary earnings of all wage and salary earners, as the index of wage and salary earnings made a slight downturn at the beginning of 2017. In 2019, the index of wage and salary earnings reached the index for regular earnings on account of performance-based non-recurring items paid in the public sector. The return of public sector holiday bonuses to the level prior to 2017 raised the index of wage and salary earnings at the beginning of 2020 to the same level as the index for regular earnings. The development described above is even more clearly visible when examining earnings development at a more detailed level, such as the local government sector or the central government sector separately.
The indices for 2021 are based on the effects of agreements and the wage drift
The indices of wage and salary earnings and the indices for regular earnings are final until 2020. They are based on the realised earnings development. The indices for 2021 are preliminary and they are based on estimates of agreement effects and the wage drift.
The figure examines the development of the index of wage and salary earnings in 2015 to 2021. The examination includes the private sector, central government and local government, and ends in the latest published quarter, that is, the second quarter of 2021.
Index of wage and salary earnings 2015=100
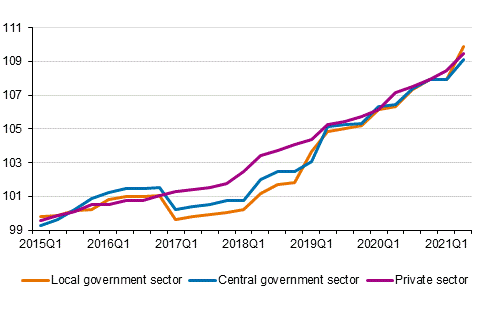
The index of wage and salary earnings in the local government sector clearly made an upturn in the second quarter of 2021. Local government sector wages and salaries were raised by a general increase and a local item in April 2021, i.e. the first month of the second quarter. In central government, the local item was paid in May and the general increase in June. For this reason the rise in the index of wage and salary earnings in central government was more moderate in the second quarter of 2021 than in the local government sector. Contractual pay increases have been more evenly scheduled in the private sector for the first and second quarters of the current year.
According to preliminary data, earnings of wage and salary earners are 2.3 per cent higher in July to September than in the year before
According to Statistics Finland’s preliminary data, nominal earnings of wage and salary earners are 2.3 per cent higher in July to September 2021 than in July to September 2020. According to preliminary data, the index of wage and salary earnings 2015=100 for the third quarter of 2021 is 109.9. Statistics Finland compiles the preliminary third quarter data for the index of wage and salary earnings on the basis of the Employees Pensions Act (2006/395).
Wage drift can also be negative
The earnings development consists of pay increases agreed in collective agreements and the so-called wage drift. The wage drift is the earnings development exceeding or below the contractual pay increase and it consists of the effects of employer-specific pay rises. In addition, changes in the structures of wage and salary earners also affect the development of average earnings. Contractual pay increases and the wage drift together form the earnings development in accordance with the index of wage and salary earnings, which includes non-recurring items based on collective agreements and performance-based bonuses.
The figure shows the average annual change in earnings development in 2019 to 2020 on the section level of the industrial classification so that contractual pay increases and the wage drifts are separated. It should be noted that the start of the state of emergency caused by the coronavirus in 2020 has no direct effect on the index of wage and salary earnings, because the statistics describe the development in the average earnings of full-time wage and salary earners for regular working hours.
Earnings development by industry (TOL2008), annual change percentage 2019-2020
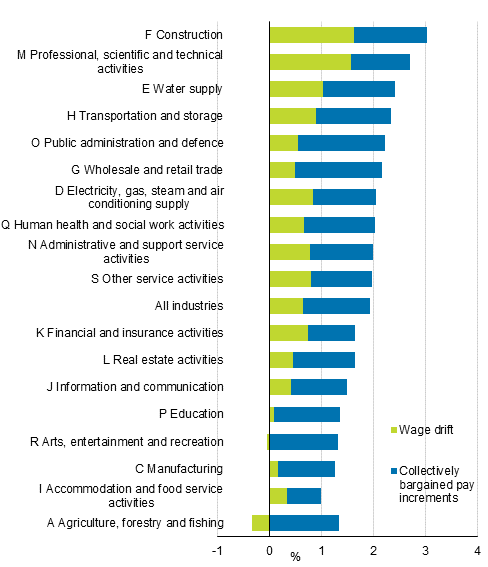
In 2020, the earnings development was fastest in construction (3.0 per cent) and in professional, scientific and technical activities (2.7 per cent). In these industries the share of the wage drift in earnings development was also highest. Earnings development was slowest in agriculture and forestry (1.0 per cent) and in accommodation and food service activities (1.0 per cent). The wage drift was negative in agriculture and forestry and also slightly negative in arts, entertainment and recreation. However, the earnings development as a whole was not negative in either of these industries, because apart from wage drifts, the earnings development consists of contractual pay increases.
In 2020, the share of contractual pay increases in earnings development was highest in the industries of trade (1.7 per cent), public administration and defence (1.7 per cent), and transportation and storage (1.5 per cent). The contractual pay increases were, in turn, smallest in the industries of accommodation and food service activities (0.7 per cent), financing and insurance (0.9 per cent), and information and communication (1.1 per cent).
The earnings development is also affected by the structural change taking place in the industry. The following section examines how the change in the occupational structure has affected the development of average earnings starting from 2010.
Earnings of private sector managers have risen most in ten years
Starting from 2010, Statistics Finland has calculated an index standardised with the main category of occupation based on the index for regular earnings, in which the earnings development of the main category of occupation in each wage and salary earner group is calculated separately. There are ten of these main categories of occupation, from managers to elementary occupations.
The figure below shows earnings development standardised with the main category of occupation by employer sector from 2010 to 2020. The main categories of occupation are divided into four categories in the figure so that managers are separately and professionals and technicians and associate professionals are combined into one category. “Clerical support workers” and “service and sales workers” are combined into the category of salaried employees and service workers and the worker category is formed by categories “skilled agricultural, forestry and fishery workers”, “craft and related trades workers”, “plant and machine operators, and assemblers” and “elementary occupations”.
Changes in regular earnings of wage and salary earners from 2010 to 2020 standardised with the main categories of occupation
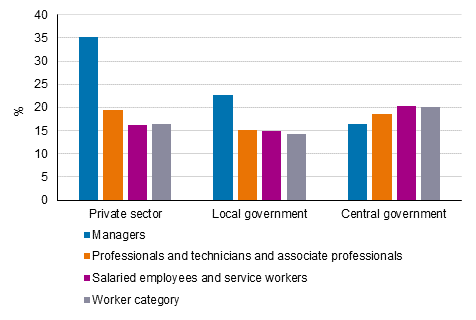
From 2010 to 2020, the earnings of private sector managers have risen most, by 35 per cent, followed by the earnings of local government managers, by 23 per cent. In these sectors, the rise in the earnings level and the earnings level had a positive correlation in the past decade.
The measured average earnings development by occupational category may have been influenced by changes in the methods used in the Classification of Occupations. The share of managers has contracted in the private and local government sectors, which may have been partly caused by classification changes. If wage and salary earners classified as managers have been re-classified into other main occupational categories and their average earnings are lower than average for managers, then the average earnings of the remaining managers are higher than before the classification changes.
The share of managers has also contracted in central government but this has not been visible in the accelerated earnings development compared to other occupational groups in central government. Earnings rose least among managers and most in the occupational groups of salaried employees and workers.
Changes in occupational structure have affected the development of average earnings in different ways in the private and public sectors
By comparing the index standardised with occupation and the index for regular earnings, we can examine how changes in the occupational structure influence the development of average earnings in different employer sectors, for example. On average, the change in the occupational structure has not much affected the development of the earnings level on the labour market, because from 2010 to 2020, the index standardised with the main category of occupation has risen by only three decimals less than the index for regular earnings without standardisation with occupation.
Change in the index of regular earnings and the index standardised with occupational structure from 2010 to 2020
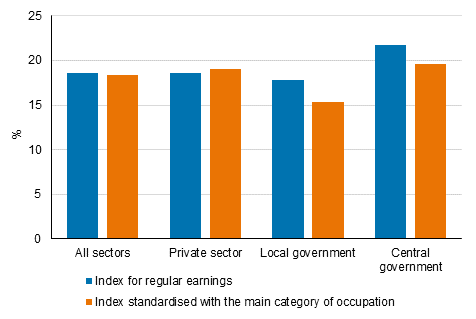
By contrast, there is a clear difference in development between the private and public sectors. In the private sector, the index standardised with occupational structure has risen in nine years by 0.4 per cent more than the non-standardised index, but in the local government sector, the index standardised with the main category of occupation has risen by 2.4 per cent less and in the central government sector by 2.0 per cent less than the non-standardised index.
In the public sector, the occupational structure has thus clearly moved towards better paid occupations, which may partly be due to the outsourcing of organisations' auxiliary activities. There is no clear direction in the private sector, as the effects of structural changes vary in both directions depending on the year.
Source: Index of wage and salary earnings 2021, 2nd quarter. Statistics Finland
Inquiries: Anu Uuttu 029 551 2322, Harri Nummila 029 551 3235, palkat.indeksit@stat.fi
Head of Department in charge: Hannele Orjala
Publication in pdf-format (500.0 kB)
- Tables
-
Tables in databases
Pick the data you need into tables, view the data as graphs, or download the data for your use.
Appendix tables
- Appendix table 1. Index of wage and salary earnings 2015=100 by employer sector and base of payment (27.8.2021)
- Appendix table 2. Index of regular earnings 2015=100 by employer sector and base of payment (27.8.2021)
- Appendix table 3. Index of wage and salary earnings 2015=100 by employer sector and gender (27.8.2021)
- Appendix table 4. Index of regular earnings 2015=100 by employer sector and gender (27.8.2021)
- Appendix table 5. Index of wage and salary earnings 2015=100 by industry, (TOL 2008) (27.8.2021)
- Appendix table 6. Index of regular earnings 2015=100 by industry, (TOL 2008) (27.8.2021)
- Appendix table 7. Index of wage and salary earnings 2010=100 by employer sector and gender (27.8.2021)
- Appendix table 8. Index of wage and salary earnings 2010=100 by industry, (TOL 2008) (27.8.2021)
- Appendix table 9. Index of wage and salary earnings 2015=100, percentage changes (27.8.2021)
- Appendix table 10. Index of regular earnings 2015=100, percentage changes (27.8.2021)
- Appendix table 11. Average earnings by employer sector and gender, EUR/month (27.8.2021)
- Revisions in these statistics
-
- Revisions in these statistics (27.8.2021)
Updated 27.8.2021
Official Statistics of Finland (OSF):
Index of wage and salary earnings [e-publication].
ISSN=1798-7814. 2nd quarter 2021. Helsinki: Statistics Finland [referred: 19.7.2024].
Access method: http://www.stat.fi/til/ati/2021/02/ati_2021_02_2021-08-27_tie_001_en.html