

Published: 14 February 2022
Turnover in trade grew in December
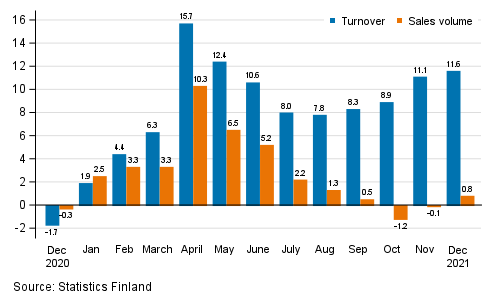
According to Statistics Finland, turnover in total trade adjusted for working days increased by 11.6 per cent in December from December 2020. The working day adjusted volume of sales in total trade, from which the impact of price changes has been eliminated, went up by 0.8 per cent. Among the industries of trade, turnover grew strongest in wholesale trade.
Annual change in working day adjusted turnover and sales volume in total trade (G), %
Turnover increased in all industries of trade
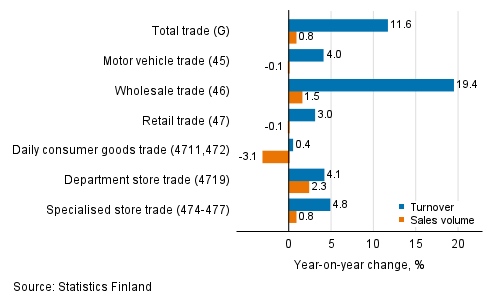
Turnover in the trade industry with the biggest turnover, wholesale trade, grew in December by 19.4 per cent and sales volume by 1.5 per cent year-on-year. The more favourable development in turnover than in sales volume in wholesale trade is explained by higher prices especially of processed petroleum products.
In retail trade, working day adjusted turnover grew in December by 3.0 per cent, but sales volume fell by 0.1 per cent. Turnover in daily consumer goods trade increased by 0.4 per cent from the previous year, while sales volume decreased by 3.1 per cent in the corresponding period. Turnover in department store trade grew by 4.1 per cent and sales volume by 2.3 per cent from the year before. Turnover in specialised store trade increased by 4.8 per cent and sales volume by 0.8 per cent from December 2020.
In December, turnover in motor vehicle trade increased by 4.0 per cent, but sales volume fell by 0.1 per cent from one year back.
Annual change in working day adjusted turnover and sales volume in industries of trade, December 2021, % (TOL 2008)
Seasonally adjusted turnover fell compared to November
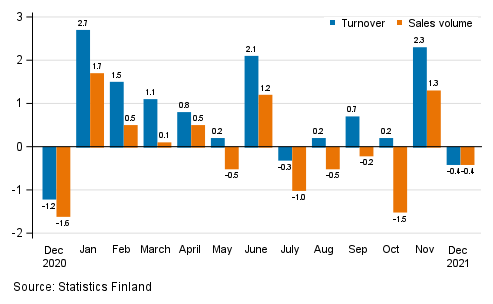
Seasonally adjusted turnover in total trade fell by 0.4 per cent in December compared to November. Seasonally adjusted sales volume decreased by 0.4 per cent. In November, seasonally adjusted turnover grew by 2.3 per cent and sales volume by 1.3 per cent compared to the month before.
Change in seasonally adjusted turnover and sales volume in total trade (G) from the previous month, %
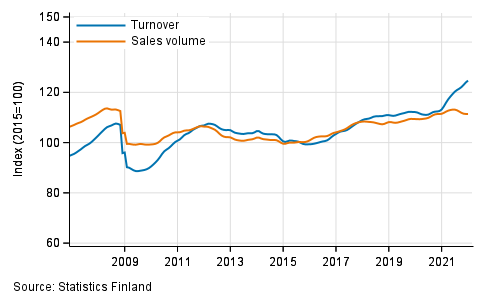
Trend of turnover and sales volume in total trade
The calculation of indices of turnover of trade is based on the Tax Administration’s data on self-assessed taxes, which are supplemented with Statistics Finland’s sales inquiry. The volume index of sales is calculated by removing the effect of price changes from the value index series.
The factors caused by the variation in the number of weekdays are taken into account in adjustment for working days. This means taking into consideration the lengths of months, different weekdays and holidays. In addition, seasonal variation is eliminated from seasonally adjusted series, on account of which it makes sense to compare observations of two successive months as well.
The data for the latest month are preliminary and they may become significantly revised particularly on more detailed industry levels in coming months.
Industries of enterprises have been revised in the data released in February
Starting from the statistical release published in February 2022, the latest industries defined by the Business Register have been taken into use in the turnover and wage and salary indices. The industry corrections are visible as revised data in some of the published industries for the years 2020–2021. The effects of the changes are taken into consideration in statistics production so that no breaks occur in the time series of the published index series. The interpretation of the statistics also remains unchanged in the renewal. Revisions to annual changes in industries are presented under Revisions in these statistics .
Source: Turnover of trade, Statistics Finland
Inquiries: Lauri Pullinen 029 551 3043, kauppa.suhdanne@stat.fi
Head of Department in charge: Katri Kaaja
Publication in pdf-format (288.8 kB)
- Tables
-
Tables in databases
Pick the data you need into tables, view the data as graphs, or download the data for your use.
Appendix tables
- Revisions in these statistics
-
- Revisions in these statistics (14.2.2022)
Updated 14.2.2022
Official Statistics of Finland (OSF):
Turnover of trade [e-publication].
ISSN=1799-0939. December 2021. Helsinki: Statistics Finland [referred: 27.7.2024].
Access method: http://www.stat.fi/til/klv/2021/12/klv_2021_12_2022-02-14_tie_002_en.html