

Published: 14 November 2008
Output of the national economy increased in September
Seasonally adjusted output increased by 0.4 per cent in September from the month before. September 2008 had two working days more than the corresponding month of the previous year. Adjusted for working days, output increased by 2.2 per cent from September 2007. According to the original series, output was 4.1 per cent higher than in September of the year before. The data derive from Statistics Finland's Trend Indicator of Output.
According to revised data, seasonally adjusted output increased in August by 0.2 per cent from the month before (previously -0.3 per cent). Output adjusted for working days increased by 1.8 per cent (previously 1.1 per cent) and the original series showed a decrease of 0.1 per cent (previously -0.9 per cent) from August 2007.
Volume of total output 2003 - 2008, trend and seasonally adjusted series
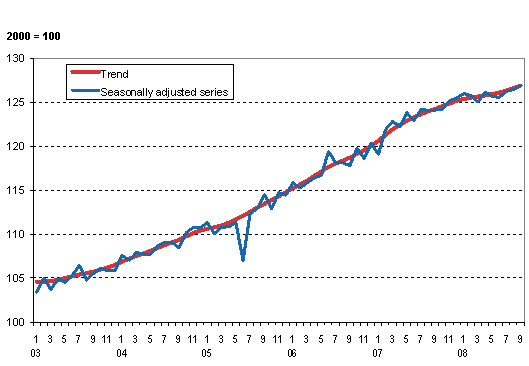
The series of the Trend Indicator of Output are seasonally adjusted with the Tramo/Seats method. The latest observations of the series adjusted for seasonal and random variation (seasonally adjusted and trend series) become revised with new observations in seasonal adjustment methods.
Working day adjusted change of total output from previous year's corresponding month, %
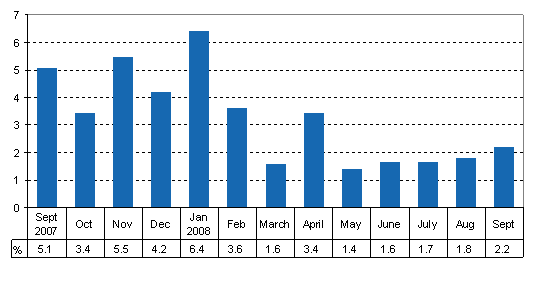
According to the working day adjusted series, primary production is estimated to have contracted by 4 per cent from September 2007. Adjusted for working days, secondary production increased by 7 per cent. The service industry stayed on level with the previous year. Secondary production includes manufacturing and construction. Services comprise trade, hotel and restaurant industries, transport and business activities as well as real estate, renting and research services, financial intermediation and insurance, and public services. Primary production refers to agriculture, forestry and fishery.
The former Monthly Indicator of Total Output is being revised
Starting from the February 2008 release, these statistics are published as the Trend Indicator of Output. The calculation of the indicator has been harmonised with the calculation methods of quarterly accounts output, and the development work will continue in 2008. The calculation of industry-specific data is now primarily based on value data deflated with previous year's average prices. This produces volume figures at previous year's prices, in which the previous year is always the base year. Volume changes at previous year's prices are used to chain a continuous volume series at reference year 2000 prices with the so-called annual overlap method. This series is published as the Trend Indicator of Output. This method corresponds to the deflation and chaining method applied to quarterly accounts output. In this publication the calculation of value data is based on 64 sources and the description of price development on 60 sources. The time series have been completely revised from 1996 onwards in accordance with the new sources and methods.
The volume of the source data used in the calculation of the Trend Indicator of Output has been increased significantly and the calculation is performed at a more detailed level than before (2-digit level of the Standard Industrial Classification). The publication level is primary production, secondary production and services. In the published indicator already a considerable proportion of the source data used in the calculation has been changed to comply with the revised quarterly accounts. As a rule, the source data used for manufacturing and private services are preliminary data from indices of turnover and the source data used for public services are preliminary data from wage and salary indices. As regards the other industries, development work still continues.
Source: Trend Indicator of Output 2008, September. Statistics Finland
Inquiries: Mr Veli-Pekka Karvinen +358 9 1734 2667, Mr Samu Hakala +358 9 1734 3756, kansantalous.suhdanteet@stat.fi
Director in charge: Mr Ari Tyrkk�
- Tables
-
Tables in databases
Pick the data you need into tables, view the data as graphs, or download the data for your use.
Last updated 14.11.2008
Official Statistics of Finland (OSF):
Trend Indicator of Output [e-publication].
ISSN=1798-5439. September 2008. Helsinki: Statistics Finland [referred: 27.7.2024].
Access method: http://www.stat.fi/til/ktkk/2008/09/ktkk_2008_09_2008-11-14_tie_001_en.html