

Published: 13 March 2015
Current account in surplus, capital outflow from Finland in the last quarter of 2014
As a result of a surplus in the primary income and goods account, the current account showed a surplus in the last quarter of 2014. The financial account showed net capital outflow from Finland. According to the preliminary data for the year 2014, the current account showed deficit, and corporate acquisitions increased capital inflow.
Current account showed a surplus in the last quarter of 2014
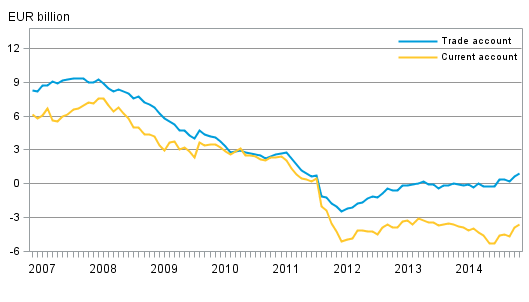
The current account showed a surplus of EUR 0.4 billion in the last quarter of 2014 which can be explained by the surplus in the primary income and goods account.
The goods account in balance of payments terms was EUR 0.4 billion as exports of goods amounted to EUR 14.2 billion and imports to EUR 13.8 billion. In the last quarter of 2014, exports of services amounted to EUR 5.4 billion and imports to EUR 5.6 billion. Exports of services fell in most service items apart from telecommunication, data processing and information services, which grew compared with the year before. In trade in goods and services, the levels of both exports and imports fell from that of the last quarter of 2013, although imports went down more than exports in both items.
In the last quarter of 2014, the primary income account showed a surplus of EUR 0.5 billion, which is explained by investment income EUR 3 billion paid to Finland. Investment income from Finland amounted to EUR 2.6 billion. Investment income includes items such as interests and dividends.
Finland’s current account and trade account, 12 moving sum
Net capital outflow from Finland in the last quarter of 2014
In the last quarter of 2014, the net capital outflow from Finland amounted to EUR 1.9 billion. Capital outflow took place mainly in the form of other investments (loans, deposits and trade credits), totalling EUR 4.6 billion, while capital inflow was mostly in the form of portfolio investments, altogether EUR 1.5 billion.
Capital was repatriated from abroad to Finland in the form of portfolio investments, amounting to EUR 0.9 billion. Finnish investors repatriated their portfolio investments particularly from foreign shares and money market instruments and correspondingly, increased their investments in bonds.
Foreign investors increased their investments in Finnish securities to the value of EUR 0.6 billion. Investments in Finnish money market instruments grew, whereas foreign investors withdrew their capital from investment funds registered in Finland and Finnish bonds.
Direct investment was EUR 0.9 billion inward on net. Direct investment assets grew by EUR 1.5 billion, while liabilities increased by EUR 2.4 billion. Other investments were EUR 4.6 billion on net.
Table 1. External assets and liabilities by investment type in 2014 Q4, EUR billion
| Opening positiion 30.9.2014 | Financial transactions 2014 Q4 | Price changes 2014 Q4 | Changes in the exchange rates and valuation adjustments 2014 Q4 | Closing position 31.12.2014 | |
| Financial account | 3.6 | 1.9 | -3.8 | -0.8 | 0.8 |
| Assets | 716.9 | -33.6 | 40.7 | -0.4 | 723.6 |
| Liabilities | 713.3 | -35.5 | 44.5 | 0.5 | 722.8 |
| Direct investment | 31.1 | -0.9 | -1.0 | -3.3 | 25.9 |
| Assets | 138.5 | 1.5 | -0.9 | -3.6 | 135.5 |
| Liabilities | 107.4 | 2.4 | 0.2 | -0.3 | 109.6 |
| Portfolio investment | -2.7 | -1.5 | -1.7 | 3.2 | -2.7 |
| Assets | 279.8 | -0.9 | 1.8 | 3.4 | 284.0 |
| Liabilities | 282.5 | 0.6 | 3.5 | 0.2 | 286.8 |
| Other investment | -42.3 | 4.6 | 0.0 | -0.9 | -38.6 |
| Assets | 175.7 | -9.4 | 0.0 | -0.1 | 166.1 |
| Liabilities | 218.0 | -14.0 | 0.0 | 0.7 | 204.7 |
| Financial derivatives | 8.9 | -0.4 | -1.1 | 0.0 | 7.5 |
| Reserve assets | 8.5 | 0.1 | 0.0 | 0.1 | 8.8 |
Current account showed a deficit, capital inflow mostly in the form of direct investment in 2014
According to preliminary data, the current account showed a deficit of EUR 3.8 billion in 2014. The current account credit and debit had no significant change compared with the levels of 2013. Apart from the goods account, the sub-items of the current account were in deficit
The trade account in balance of payments terms was EUR 0.7 billion in surplus in 2014 and the service account was EUR 1.5 billion in deficit. In combined trade in goods and services, imports fell more than exports. Exports of services went down in almost all sub-items. In telecommunication, computer and information services, exports grew from the previous year. Imports of services also declined in most services.
The primary income account showed a deficit of EUR 0.5 billion, as credit flows amounted to EUR 14 billion and debit flows to EUR 14.6 billion. In 2013, the primary income account showed a surplus of EUR 0.3 billion. The most important item in the primary income account is investment income, of which EUR 12.5 billion were paid to Finland and EUR 13.5 billion abroad from Finland.
The secondary income account was EUR 2.5 billion in deficit. The secondary income account includes such as payments to international organisations.
Corporate acquisitions increased liabilities
According to preliminary data, inward capital flow on net to Finland amounted to EUR 9.3 billion in 2014.
Net capital inflow to Finland was mostly in the form of direct investment, totalling EUR 13.6 billion. The growth in direct investment liabilities compared to the year before is mainly explained by the recovery of corporate acquisitions. Direct investment assets were EUR 135.5 billion and liabilities EUR 109.6 billion. The net international position connected to direct investment has clearly contracted in the course of 2014, which is mainly accountable to changes in intra-group loans.
Net capital outflow from Finland was mainly in the form of portfolio investments, EUR 5.5 billion. Outward portfolio investments amounted to EUR 13.3 billion, which is mainly a consequence of investments made by Finnish financial institutions and mutual funds registered in Finland in foreign quoted shares and bonds, as well as employment pension schemes' investments in foreign mutual fund shares. Foreign investments in Finnish securities totalled EUR 7.8 billion. Foreign investors purchased particularly bonds issued by financial institutions and other financial intermediaries.
At the end of 2014, Finland had EUR 723.6 billion in foreign assets and EUR 722.8 billion in foreign liabilities. Finland's net international investment position fell from EUR 9.7 billion at the end of 2013 to EUR 0.8 billion at the end of 2014, which is mainly explained by growing foreign liabilities in direct investments.
Revisions in recording of balance of payments
In accordance with new international standards the balance of payments now includes claims and liabilities related to the issuance of euro bank notes and their allocation within the Eurosystem. The recording was directed to other investments from 2006 onwards. The recording decreased Finland's net international investment position by EUR 5.2 billion at the end of 2014.
Interest income received from the European Central Bank related to the allocation of euro notes within the Eurosystem was added to primary income interests.
Differences between the current account of balance of payments and national accounts
The current account according to the national accounts and balance of payments still deviates in some respects although by definition it is the same item. The differences are caused by the versions of source data and differing treatment of some items (e.g. manufacturing services, FISIM) and divergent release schedules.
Table 2. External assets and liabilities by investment type in 2014 Q4, EUR billion
| Corrected on 13. March 2015 at 15:00 am. The corrections are indicated in red. | |||||
| Assets and liabilities | Stock 31.12.2013 | Financial transactions in 2014 | Price changes in 2014 | Changes in the exchange rates and valuation adjustments in 2014 | Stock 31.12.2014 |
| Financial account | 9.7 | -9.3 | -5.6 | 6.0 | 0.8 |
| Assets | 651.4 | -59.5 | 116.7 | 15.1 | 723.6 |
| Liabilities | 641.7 | -50.3 | 122.3 | 9.1 | 722.8 |
| Direct investment | 44.9 | -13.6 | -9.1 | 3.7 | 25.9 |
| Assets | 139.3 | 0.4 | -8.7 | 4.5 | 135.5 |
| Liabilities | 94.4 | 14.0 | 0.4 | 0.8 | 109.6 |
| Portfolio investment | -14.0 | 5.5 | 0.0 | 5.8 | -2.7 |
| Assets | 250.9 | 13.3 | 11.1 | 8.8 | 284.0 |
| Liabilities | 264.9 | 7.8 | 11.1 | 3.0 | 286.8 |
| Other investment | -34.4 | -0.2 | 0.0 | -4.0 | -38.6 |
| Assets | 167.7 | -3.4 | 0.0 | 1.9 | 166.1 |
| Liabilities | 202.1 | -3.2 | 0.0 | 5.9 | 204.7 |
| Financial derivatives | 5.0 | -0.7 | 3.3 | -0.1 | 7.5 |
| Reserve assets | 8.2 | –0.2 | 0.0 | 0.6 | 8.8 |
Finland’s balance of payments in January 2015
The current account showed a deficit of EUR 0.5 billion in January. One year earlier, the current account showed a deficit of EUR 0.7 billion. The 12-month moving total of the current account was EUR 3.6 billion in deficit.
In January 2015, foreign financial liabilities increased more than financial claims resulting in net capital inflow. The total net capital inflow to Finland amounted to EUR 2.5 billion, of which direct investment was EUR 4.4 billion. Portfolio investment was EUR 2.2 billion outward on net.
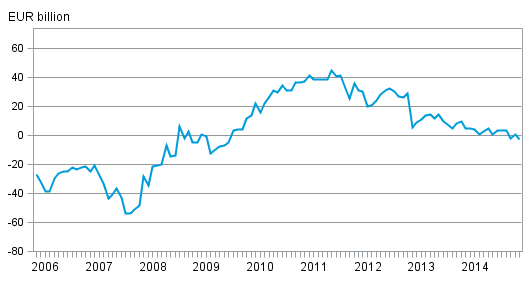
At the end of January 2015, the net international investment position amounted to EUR -2.6 billion with foreign assets amounting to EUR 784.3 billion and liabilities to EUR 786.9 billion. The change in the net international investment position was mainly caused by the recording of claims and liabilities related to the issuance of euro bank notes and their allocation within the Eurosystem.
The data for January 2015 will be published on 15 April 2015.
Finland’s monthly international investment position
Source: Balance of payments and international investment position, Statistics Finland
Inquiries: Mira Malhotra 029 551 3411, Tapio Kuusisto 029 551 3318, balanceofpayments@stat.fi.
Director in charge: Leena Storg�rds
Publication in pdf-format (307.0 kB)
- Tables
-
Tables in databases
Pick the data you need into tables, view the data as graphs, or download the data for your use.
Appendix tables
- Appendix table 1. Finland's current account, quarterly 2014, EUR million (13.3.2015)
- Appendix table 2. External asset and liability flows by sector, quarterly 2014, EUR million (13.3.2015)
- Appendix table 3. International investment position by sector, quarterly 2014, EUR million (13.3.2015)
- Appendix table 4. Finland's balance of payments 2015, EUR million (13.3.2015)
- Figures
Updated 13.3.2015
Official Statistics of Finland (OSF):
Balance of payments and international investment position [e-publication].
ISSN=2342-348X. January 2015. Helsinki: Statistics Finland [referred: 27.7.2024].
Access method: http://www.stat.fi/til/mata/2015/01/mata_2015_01_2015-03-13_tie_001_en.html