

Published: 15 March 2018
Current account in surplus, net international investment position positive
The current account was in surplus in the last quarter of 2017 as exports of goods and services grew faster than imports. The services account was in balance. According to Statistics Finland's preliminary data, the current account for the whole year 2017 was EUR 1.6 billion in surplus. The exports of goods and services in the whole year 2017 also grew clearly. Exports continued to grow in January. Net international investment position strengthened during the last quarter of 2017.
Current account and goods and services account
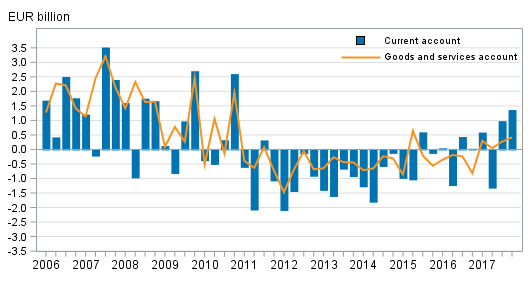
Current account
In 2017, the current account was EUR 1.6 billion in surplus. The current account was in surplus for the first time since the year 2010. In the last quarter of 2017 balance of payments terms, the trade account was in surplus and the services account was in balance. In the last quarter of 2017 the primary income account was also in surplus.
Goods and services
In balance of payments terms, the trade account was EUR 0.4 billion in surplus in the last quarter of 2017. In the corresponding quarter of the previous year, the trade account was EUR 0.1 billion in deficit. In 2017, the trade account strengthened and the surplus amounted to EUR 2.2 billion. The services account was in balance in the last quarter of 2017. The services account strengthened by good EUR 1 billion during 2017. The services account was strengthened in particular by increased exports of other business services and decreased imports of financial services.
Exports of goods in balance of payments terms grew to EUR 15.4 billion in the last quarter of 2017 or by 10 per cent from the corresponding period in the year before. Goods imports increased to EUR 15.0 billion, rising by 6 per cent year-on-year. Exports of goods in balance of payments terms in 2017 amounted to EUR 60 billion and grew by EUR 6.6 billion, that is, 12 per cent from one year ago. In 2017, goods imports grew by 10 per cent.
In the last quarter of 2017, service exports grew by 13 per cent and service imports by 2 per cent. As a result, both service exports and imports reached good EUR 7 billion and thus the services account was in balance. Service exports that stood at EUR 26.3 billion in 2017 grew by close on EUR 2 billion, that is, by 8 per cent from the previous year. Service imports amounted to EUR 27.4 billion and grew by 3 per cent compared with the year before.
Import and export figures in balance of payments terms by service item and area can be found in the statistics on international trade in goods and services starting from 2015. Adjustments made to the Finnish Customs figures, which result in goods trade in balance of payments terms, are also broken down in the statistics on international trade in goods and services.
A revision has been made in the time series of goods and services for 2006 to 2013. Value added of factoryless goods production that belonged to exports of manufacturing services has, since 2006, been included in goods exports. A corresponding change was made starting from 2014 already in March 2017. As a result of this change, the level of service exports prior to 2014 decreases and the level of goods exports increases. The revision does not change the combined value of goods and services exports.
Primary income and secondary income
The primary income account was EUR 1.5 billion in surplus in the last quarter of 2017. The primary income account is made up of compensation of employees, investment income and other primary income paid abroad from Finland and from abroad to Finland. The surplus of primary income is mainly due to investment income, which covers returns on capital such as interests and dividends. EUR 1.2 billion were paid in investment income to Finland in net in the last quarter of 2017, which is 7 per cent less than in the corresponding period last year. In 2017, the primary income account was EUR 2.7 billion in surplus, which is 21 per cent less than the year before.
The secondary income account was EUR 0.5 billion in deficit in the last quarter of 2017. The deficit was 20 per cent lower than in the corresponding period last year. In 2017, the deficit of the secondary income account was EUR two billion, which is 17 per cent lower than the deficit in the year before.
Current account in surplus in January 2018
The current account was EUR 0.3 billion in surplus in January. The value of goods exports in balance of payments terms grew by 10 per cent from twelve months back. Of the sub-items of the current account, the goods account in balance of payment terms and the primary income account were in surplus. The services account and the secondary income account were in deficit.
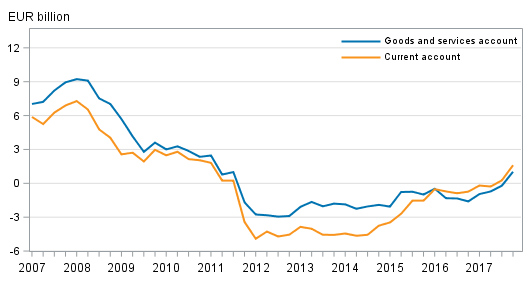
Finland’s current account and goods and services account, 12 –month moving sum
Financial account and net international investment position
Net international investment position strengthened
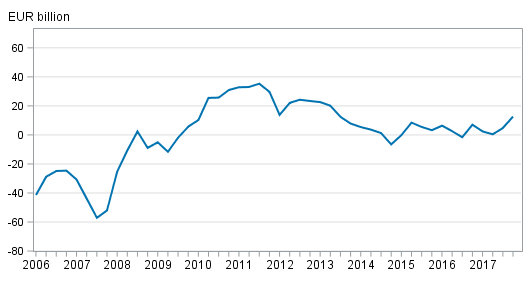
At the end of the fourth quarter of 2017, Finland had EUR 620.6 billion in foreign assets on gross and EUR 607.9 billion in foreign liabilities on gross. Thus, the net international investment position was positive at the end of the fourth quarter as assets exceeded liabilities with EUR 12.7 billion. The net investment position strengthened compared with the the previous quarter, when the net investment position was EUR 4.8 billion. Both foreign assets and liabilities decreased in the fourth quarter. Capital flowed out from assets with EUR 41.8 billion, but other valuation changes, that is, changes in exchange rates, prices and other changes, increased the stock of assets by EUR 26.7 billion. EUR 38.2 billion of liabilities were paid off, but for liabilities other valuation changes also increased the stock by EUR 15.2 billion.
Examined by sector, the net international investment position improved in the fourth quarter of 2017 most due to the improved net investment position of the other monetary financial institutions sector from EUR -152.3 billion to EUR -125.7 billion and that of the non-financial corporations sector from EUR -71.6 billion to EUR -62.2 billion. Social security funds had the biggest foreign net assets, EUR 137.8 billion, while other monetary financial institutions sector held the largest foreign net liabilities.
Finland’s net international investment position quarterly
Capital flowed to Finland as direct investments and portfolio investments
In the fourth quarter of 2017, net capital inflow to Finland amounted to EUR 3.6 billion, which weakened the net international investment position. Examined by type of investment, capital flowed to Finland on net as direct investments and portfolio investments. Outward capital flow was mostly in the form of other investments, that is, for example, as non-group loans, deposits and trade credits, EUR 4.6 billion on net.
At the end of the fourth quarter of 2017, direct investment assets on gross stood at EUR 154.8 billion and the corresponding liabilities at EUR 112.8 billion. The net investment position of direct investments was thus positive at the end of the fourth quarter as there were EUR 42.0 billion more assets than liabilities. The net international investment position of direct investments weakened in the fourth quarter when assets from foreign direct investments decreased and liabilities increased somewhat. Assets from foreign direct investments decreased in the fourth quarter by EUR 2.6 billion on net and, in addition, other valuation changes related to assets decreased gross assets by EUR 1.8 billion in the fourth quarter. Liabilities from direct investments increased by EUR 1.0 billion on net but other valuation changes related to liabilities decreased gross liabilities by EUR 0.9 billion in the fourth quarter.
The net international position of portfolio investments improved in the fourth quarter of 2017 as assets from portfolio investments grew and the stock of liabilities fell. Portfolio investment assets amounted to EUR 314.9 billion and portfolio investment liabilities to EUR 308.5 billion at the end of the fourth quarter. In the last quarter, the growth in assets came from other valuation changes as financial transactions decreased assets. Portfolio investment assets grew in equity and mutual fund shares. Assets from mutual fund shares grew heavily also in previous quarters. Assets from bonds, in turn, continued declining in the last quarter when the assets from bonds amounted to EUR 127 billion. Assets from bonds decreased both, as a result of financial transactions and valuation changes. The liability stock decreased from the previous quarter mainly due to valuation changes. The stock of liabilities in equity and mutual fund shares amounted to EUR 117.9 billion. Liabilities from money market instruments and bonds increased and stood at EUR 190.6 billion at the end of the last quarter.
In the fourth quarter, financial transactions decreased other investments assets, e.g. loans from outside the group, deposits and trade credits, by EUR 10.5 billion on net. Capital was also decreased from other investment liabilities, EUR 15.0 billion on net. At the end of the fourth quarter, other investments assets amounted to EUR 121.3 billion and liabilities to EUR 167.0 billion.
At the end of the fourth quarter of 2017, Finland had EUR 0.9 billion in derivative-related net assets, which is EUR 0.6 billion more than at the end of the third quarter. Both derivative-related assets and liabilities have declined considerably compared to one year ago mainly as a result of international company restructurings. Assets have contracted from EUR 89.6 billion to EUR 20.5 billion and liabilities from EUR 86.4 billion to EUR 19.6 billion.
Revision of data concerning the international investment position
In accordance with the objective of harmonisation of Financial accounts and IIP data, the data has been revised for 2015 to 2017.
Financial account in January 2018
In January, net capital outflow from Finland amounted to EUR 2.1 billion. Of the sub-items of the financial account, net capital outflow from Finland was mostly in the form of portfolio investments, EUR 5.0 billion. Inward capital flow was mostly in the form of other investments, EUR 1.9 billion.
Source: Balance of payments and international investment position, Statistics Finland
Inquiries: Tapio Kuusisto 029 551 3318, Pauliina Turunen 029 551 2958, balanceofpayments@stat.fi.
Director in charge: Ville Vertanen
Publication in pdf-format (313.1 kB)
- Tables
-
Tables in databases
Pick the data you need into tables, view the data as graphs, or download the data for your use.
Appendix tables
Updated 15.03.2018
Official Statistics of Finland (OSF):
Balance of payments and international investment position [e-publication].
ISSN=2342-348X. January 2018. Helsinki: Statistics Finland [referred: 1.7.2024].
Access method: http://www.stat.fi/til/mata/2018/01/mata_2018_01_2018-03-15_tie_001_en.html