

Published: 20 September 2019
Current account in deficit in the second quarter, net international investment position strengthened
The current account was in deficit in the second quarter of 2019. The value of goods exports in balance of payments terms remained on level with the corresponding quarter of last year. The primary income account was strongly in deficit. Growth in service exports was strong. The net international investment position strengthened. The data appear from Statistics Finland's statistics on balance of payments and international investment position.
Current account and goods and services account
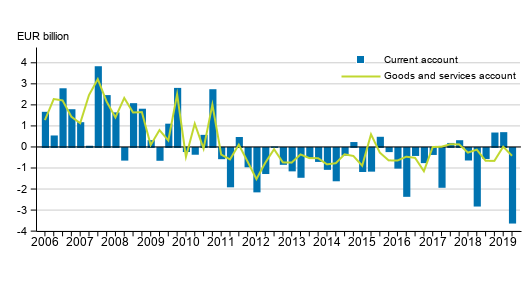
Current account
In the second quarter of 2019, the current account was EUR 3.6 billion in deficit. The balance of goods and services showed a deficit of EUR 0.4 billion. Of the sub-items of the current account, the primary income account was EUR 2.7 billion in deficit and the secondary income account EUR 0.5 billion in deficit.
Goods and services
The trade account in balance of payments terms was EUR 0.2 billion in surplus in the second quarter of 2019. In the corresponding quarter of the previous year, the trade account surplus amounted to EUR 0.9 billion. The service account showed a deficit of EUR 0.7 billion in the second quarter of 2019. The deficit in the service account is explained in particular by the deficit in tourism, transport and other business services.
Goods exports in balance of payments terms amounted to EUR 16.4 billion in the second quarter of 2019 so goods exports remained on level with the corresponding quarter of last year. Goods imports grew to EUR 16.1 billion or by four per cent year-on-year. In the second quarter of 2019, service exports grew by 13 per cent and service imports by seven per cent compared to the corresponding quarter of the previous year. Service exports amounted to EUR 7.2 billion and service imports to EUR 7.9 billion and, thus, the service account was in deficit.
More detailed import and export figures in balance of payments terms by service item and area can be found in the statistics on international trade in goods and services starting from 2015. Decreases and increases made to the Finnish Customs figures, which result in goods trade in balance of payments terms, are also broken down in the statistics on international trade in goods and services.
Primary income in the second quarter
The primary income account was EUR 2.7 billion in deficit in the second quarter of 2019. The primary income account includes compensation of employees, investment income and other primary income paid abroad from Finland and from abroad to Finland. The deficit of primary income was mainly due to investment income, which includes e.g. returns on capital like interests and dividends. A total of EUR 2.8 billion were paid from Finland in investment income on net in the second quarter of 2019.
The secondary income account was EUR 0.5 billion in deficit in the second quarter of 2019.
Current account in balance in July 2019
The current account was in balance in July. The value of goods exports in balance of payments terms grew by two per cent from twelve months back. Of the sub-items of the current account, the primary income account was in surplus. The trade account in balance of payments terms, the service account and the secondary income account were in deficit.
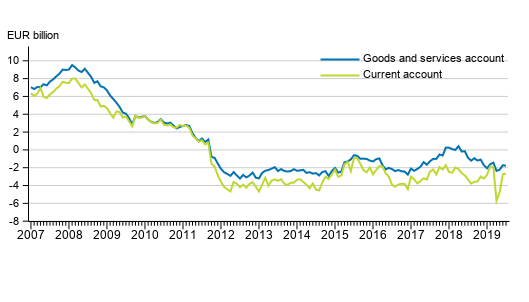
Finland’s current account and goods and services account, 12 –month moving sum
Financial account and net international investment position
Net international investment position strengthened from the previous quarter
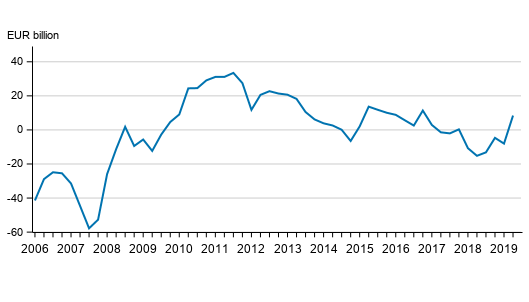
At the end of the second quarter of 2019, Finland had EUR 821.9 billion in foreign assets on gross and EUR 813.5 billion in foreign liabilities on gross. The net international investment position, that is, the difference between the stock of assets and liabilities, was thus EUR 8.4 billion as there were more assets than liabilities. Balance of payments data has been revised from 2006. Time series revision is explained in other section.
The net international investment position improved from the previous quarter when the net international investment position was EUR -8.0 billion. Financial transactions stood for EUR 9.9 billion and changes in classifications and other valuation changes for EUR 6.6 billion of the change in the net international investment position.
Examined by type of investment, the biggest net assets, EUR 47.9 billion were in direct investments. The net assets of other investments amounted to EUR 28.5 billion. Highest net liabilities, EUR 79.6 billion were in portfolio investments, which is explained by the stock of liabilities in bonds and money market instruments which had a net liability of EUR 134.9 billion. However, equity and investments fund shares amounted to a net surplus of EUR 55.4 billion.
Finland’s net international investment position quarterly
Capital outflow from Finland in the form of other investments
In the second quarter of 2019, net capital outflow from Finland was largely in form of other investments, which amounted to an outflow of EUR 11.8 billion. The primary financial assets in this type of investment are cash and deposits, as well as loans. Capital inflow to Finland was in the form of portfolio investments, which amounted to an inflow of EUR 5.8 billion.
Examined by investor sectors, foreign assets increased most in the other monetary financial institutions and social security funds. Growth in the stock of liabilities is due to the growth in the liabilities of the government sector. When the net investment position is examined by sector, social security funds had most net foreign assets, EUR 147.9 billion, of which employment pension schemes comprise the majority. EUR 113.2 billion of social security funds’ net foreign assets were in shares and mutual fund shares. Other monetary financial institutions, EUR 124.3 billion and enterprises, EUR 86.5 billion had most net liabilities.
Financial account in July 2019
Financial account showed net capital inflow of EUR 8.4 billion. By functional category, net capital inflow of EUR 15.4 billion was in form of other investments and net capital outflow of EUR 6.3 billion in form of portfolio investments.
Time series revision on the data of the balance of payments and international investment position in the September 2019 release
The data of the statistics on balance of payments and international investment position have been level revised for 2006 to 2019. The main goal of the time series revision is to promote cohesion between balance of payments and international investment position and national accounts. In addition, the temporal comparability of the data has been improved and new data sources have been utilised in connection with the time series revision.
The biggest change in goods and services is directed at the treatment of so-called project deliveries. Previously the income from project deliveries were recorded as construction and project delivery exports and the costs as construction and project delivery imports. In connection with the time series revision, net recording was adopted, which decreases the levels of service exports and imports by at most EUR 1.3 billion in 2016. Another important change in recording methods that lowers the levels of exports and imports is how recordings related to international trade are made, which decreases goods exports and imports by at most EUR 0.4 billion in 2014. The above-mentioned revisions do not affect the level of net exports.
The changes that affect net exports most were directed at goods trade related to global production and weakened net exports by at most EUR 0.5 billion in 2016.
In terms of investment income, property income of direct investments related to enterprise reorganisations were revised, and the coverage of investment income was expanded by considering reinvested earnings of mutual funds and investment income of insurance policyholders. The revisions related to enterprise reorganisations increased the deficit of the current account at most by EUR 2.0 billion in 2016 but the coverage revision of investment income decreased the deficit at most by EUR 1.1 billion in 2017.
Other accounts than investment income of the primary income account and the secondary income account were harmonised with the national accounts. As a result of these revisions, the deficit of the current account decreased at most by EUR 0.6 billion in 2008 and increased at most by EUR 0.1 billion in 2011.
The coverage of the data on the international investment position and the financial account have been improved, and coherence with financial accounts data has increased. Since 2016, international loans and deposits of the household sector have been added to the data on the international investment position and the financial account. These data are classified as other investments.
Data on technical provisions has been added since 2006.
Data concerning direct investments have been revised for 2013 to 2016.
The international stock of liabilities from bonds have been harmonised with the data of financial accounts concerning central government and other financial institutions.
In terms of employment pension schemes, clearing receivables related to securities trading and lending have been revised in terms of the timing of recording.
Source: Balance of payments and international investment position, Statistics Finland
Inquiries: Hanna Björklund 029 551 3296, Risto Sippola 029 551 3383, balanceofpayments@stat.fi.
Director in charge: Ville Vertanen
Publication in pdf-format (339.3 kB)
- Tables
-
Tables in databases
Pick the data you need into tables, view the data as graphs, or download the data for your use.
Appendix tables
- Appendix table 1. Current account, quarterly 2019, EUR million (20.9.2019)
- Appendix table 2. External assets and liabilities by sector, quarterly 2019, EUR million (20.9.2019)
- Appendix table 3. International investment position by sector, quarterly 2019, EUR million (20.9.2019)
- Appendix table 4. Balance of payments, EUR million (20.9.2019)
Updated 20.09.2019
Official Statistics of Finland (OSF):
Balance of payments and international investment position [e-publication].
ISSN=2342-348X. July 2019. Helsinki: Statistics Finland [referred: 1.7.2024].
Access method: http://www.stat.fi/til/mata/2019/07/mata_2019_07_2019-09-20_tie_001_en.html