

2. Persons suspected of solved offences and victims of offences
2.1 Solved offences
During 2017, the police, customs and border guard solved a total of 644,500 offences. The clearance rate was 74.8 per cent, which was 2.4 percentage points lower than in the previous year. Altogether, 272,900 offences against the Penal Code were solved and their clearance rate was 62.3 per cent, which was 1.2 percentage points higher than in 2016. The clearance rate for offences is calculated so that the offences recorded by the police in the statistical reference year and all the offences solved in that same year are compared with each other. For this reason, the clearance rate may be over 100 for some offences.
Among municipalities of over 30,000 inhabitants the clearance rate of offences against the Penal Code was the highest in Savonlinna (81.8%), Sein�joki (74.2%) and Lappeenranta (72.8%). The lowest clearance rates were found in Hyvink�� (46.3%), Kerava (46.6%) and J�rvenp�� (48.8%).
The clearance rate varies by type of offence quite strongly. In all, 38.2 per cent of offences against property and 65.8 per cent of offences against life and health were solved. Due to the manner of disclosure, drunken driving and traffic offences, and offences involving intoxicating substances almost all become solved. In all, 70.6 per cent of frauds (Penal Code, Section 36, Paragraphs 1 to 3) and 80.8 per cent of offences against life were solved. The clearance rate was 64.8 per cent for assault offences.
The clearance rates are the lowest for theft offences (theft, aggravated theft, petty theft), damages to property, means of payment frauds and unauthorised thefts of a motor vehicle. In 2017, fewer than every sixth theft (Penal Code, Section 28, Paragraphs 1 to 2) was solved. In turn, one-half of petty thefts were solved. One-fifth of damages to property and means of payment frauds were cleared. One-third of unauthorised thefts of a motor vehicle were solved. Good one-half of robberies were solved.
Table 5. Clearance rate of certain types of offences in 1986-2017
| Offence | 1986 - 1990 | 1991 - 1995 | 1996 - 2000 | 2001 - 2005 | 2006 - 2010 | 2011 - 2015 | 2016 | 2017 |
| Offences against the Criminal Code | 69 | 58 | 57 | 63 | 67 | 63 | 61 | 62 |
| Theft | 25 | 17 | 14 | 16 | 18 | 15 | 15 | 15 |
| Aggravated theft | 39 | 29 | 40 | 41 | 38 | 34 | 33 | 37 |
| Petty theft | 78 | 70 | 67 | 58 | 57 | 56 | 54 | 50 |
| Robbery | 53 | 43 | 42 | 45 | 49 | 54 | 53 | 56 |
| Damages to property | 29 | 27 | 27 | 26 | 25 | 22 | 22 | 23 |
| Attempted manslaughter, murder or killing | 96 | 91 | 92 | 94 | 97 | 92 | 88 | 100 |
| Assault | 79 | 74 | 76 | 80 | 81 | 76 | 67 | 66 |
| Aggravated assault | 85 | 84 | 83 | 87 | 88 | 84 | 81 | 80 |
| Petty assault | 95 | 86 | 79 | 75 | 73 | 72 | 66 | 60 |
| Rape | 63 | 56 | 57 | 63 | 66 | 70 | 67 | 71 |
| Sexual abuse of a child | 91 | 84 | 88 | 82 | 86 | 75 | 69 | 63 |
2.2 Persons suspected of offences
In all, 297,800 persons were suspected of the 272,900 solved offences against the Penal Code in 2017. The same person can be a suspect of several different offences. Of the suspects, 18.6 per cent were women, which is 1.3 percentage points lower than in 2016. When calculating according to the most aggravated offence against the Penal Code of a person (a person can be a suspect only one time during the year), 127,100 different persons were suspects of whom 22.3 per cent were women. Thus, one person was a suspect of 2.3 offences, on average.
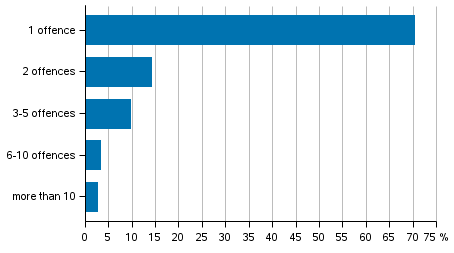
The majority of suspects, 70.4 per cent, were suspects of only one offence against the Penal Code in 2017. In all, 14.1 per cent were suspects of two offences. Of the suspects, 15.5 per cent were suspected of more than two offences.
Figure 9. Persons suspected of offences against the Criminal Code by number of offences in 2017, %
In addition to the quantitative difference, the criminality of men and women differs in that women's shares of assaults, drunken driving and damages to property were small compared to men. However, the share of women suspected of assaults has grown from under 10 per cent in 1980 to around 20 per cent. Typical crimes for women were petty thefts, frauds, embezzlements and forgeries. The most common age for male suspects was 18 years and that of female suspects 20 years. The average age of suspected men was 33.7 years and that of women 34.6 years.
Of persons suspected of solved offences 26 per cent were under the influence of some intoxicant. Of the suspects, 15 per cent were under the influence of alcohol, nine of some other intoxicant and two per cent of alcohol and some other intoxicant. In offences against property, 14 per cent of suspects were under the influence of some intoxicant. In crimes against life and health, 44 per cent and in rapes, 32 per cent of suspects were under the influence of an intoxicant.
Table 6. Suspects of solved offences against the Criminal Code by age and sex in 2008-2017, share per 1,000 population
| Gender/age group | 2008 | 2009 | 2010 | 2011 | 2012 | 2013 | 2014 | 2015 | 2016 | 2017 | |
| Total | Total | 76 | 72 | 69 | 69 | 64 | 62 | 59 | 58 | 57 | 54 |
| Aged under 15 | 16 | 14 | 13 | 14 | 11 | 10 | 9 | 8 | 8 | 9 | |
| Aged 15-17 | 128 | 123 | 122 | 126 | 109 | 103 | 98 | 91 | 84 | 82 | |
| Aged 18-20 | 239 | 217 | 208 | 214 | 201 | 198 | 185 | 185 | 180 | 199 | |
| Aged over 20 | 79 | 75 | 72 | 71 | 67 | 65 | 63 | 62 | 60 | 56 | |
| Male | Total | 128 | 119 | 115 | 115 | 106 | 102 | 97 | 95 | 92 | 89 |
| Aged under 15 | 23 | 20 | 18 | 20 | 15 | 14 | 13 | 12 | 12 | 14 | |
| Aged 15-17 | 212 | 199 | 194 | 203 | 176 | 167 | 161 | 149 | 134 | 133 | |
| Aged 18-20 | 384 | 343 | 332 | 340 | 320 | 314 | 290 | 292 | 279 | 332 | |
| Aged over 20 | 135 | 127 | 123 | 120 | 112 | 108 | 104 | 102 | 99 | 93 | |
| Female | Total | 26 | 26 | 25 | 26 | 23 | 24 | 23 | 23 | 22 | 20 |
| Aged under 15 | 7 | 7 | 8 | 8 | 6 | 5 | 4 | 4 | 4 | 5 | |
| Aged 15-17 | 40 | 44 | 46 | 47 | 39 | 37 | 33 | 31 | 31 | 28 | |
| Aged 18-20 | 87 | 85 | 79 | 82 | 77 | 77 | 76 | 72 | 76 | 60 | |
| Aged over 20 | 27 | 26 | 25 | 26 | 24 | 25 | 24 | 24 | 23 | 21 | |
In 2017, the share of underage and young people, aged under 21, among all suspects of offences against the Penal Code was 19.8 per cent, having been 17.9 per cent one year earlier. The shares of young people were large for alcohol offences, robberies, damages to property, thefts of a motor vehicle, and aggravated endangering of traffic safety. Young people made up 39.2 per cent of persons suspected of robberies, 40.3 per cent of suspects of damages to property and 31.6 per cent of those suspected of aggravated endangering of traffic safety. In all, 20.5 per cent of those suspected of assaults were young people.
The share of suspects aged over 64 has increased especially in traffic offences. There were 50,000 persons aged over 64 suspected of endangerment of traffic safety and traffic infractions, or 12 per cent of all suspects of such offences. In 2006, the corresponding share was 3.5 per cent (12,000 persons).
2.3 Backgrounds of suspects
The average income subject to state taxation of suspects of offences against the Penal Code aged 15 or over belonging to the registered population (living permanently and temporarily in Finland and with a Finnish personal identity code) was around EUR 24,000, while the corresponding income in total population was about EUR 28,800. Income tax is paid to the state on both earned income and capital income. The corresponding median income was EUR 15,700 and EUR 23,700. Of the suspects, 24.7 per cent had an income of under EUR 5,000, while this was so for 10.0 per cent of the entire population. Among the suspects, 41.7 per cent had an income of at least EUR 20,000, while the share for the entire population was 57.9 per cent. All those whose income subject to state taxation is not known also belong to the group of under EUR 2,499. The figures given in this Section are calculated so that one person is a suspect only one time. The figures calculated here differ from the figures presented elsewhere in this publication where the same person can be a suspect several times during a year. The figures only include persons suspected of offences against the Penal Code. The data on income subject to state taxation of suspects are based on the Tax Administration's data in the tax database concerning income subject to state taxation from 2016. In the sections concerning total population, only people permanently resident in Finland were taken into consideration.
Table 7. Persons suspected of offences by sex and income (euro) in 2017, aged 15 and over
| Income/sex | Total | - 2,499 | 2,500 - 4,999 | 5,000 - 9,999 | 10,000 - 19,999 | 20,000 - 39,999 | 40,000 - ?79,999 | 80,000 and over | ||
| Income subject to state taxation | Sex total | Persons suspected | 120,476 | 23,945 | 5,816 | 18,562 | 21,919 | 30,141 | 16,368 | 3,725 |
| % | 100.0 | 19.8 | 4.8 | 15.4 | 18.1 | 25.0 | 13.5 | 3.0 | ||
| Men | Persons suspected | 93,705 | 19,615 | 4,537 | 14,170 | 15,946 | 22,540 | 13,649 | 3,248 | |
| % | 100.0 | 20.9 | 4.8 | 15.1 | 17.0 | 24.0 | 14.5 | 3.4 | ||
| Women | Persons suspected | 26,771 | 4,330 | 1,279 | 4,392 | 5,973 | 7,601 | 2,719 | 477 | |
| % | 100.0 | 16.1 | 4.7 | 16.4 | 22.3 | 28.3 | 10.1 | 1.7 | ||
| Disposable income | Sex total | Persons suspected | 120,476 | 15,104 | 5,238 | 14,555 | 38,463 | 38,188 | 7,536 | 1,392 |
| % | 100.0 | 12.5 | 4.3 | 12.0 | 31.9 | 31.6 | 6.2 | 1.1 | ||
| Men | Persons suspected | 93,705 | 12,633 | 4,317 | 11,837 | 29,197 | 28,292 | 6,187 | 1,242 | |
| % | 100.0 | 13.4 | 4.6 | 12.6 | 31.1 | 30.1 | 6.6 | 1.3 | ||
| Women | Persons suspected | 26,771 | 2,471 | 921 | 2,718 | 9,266 | 9,896 | 1,349 | 150 | |
| % | 100.0 | 9.2 | 3.4 | 10.1 | 34.6 | 36.9 | 5.0 | 0.5 | ||
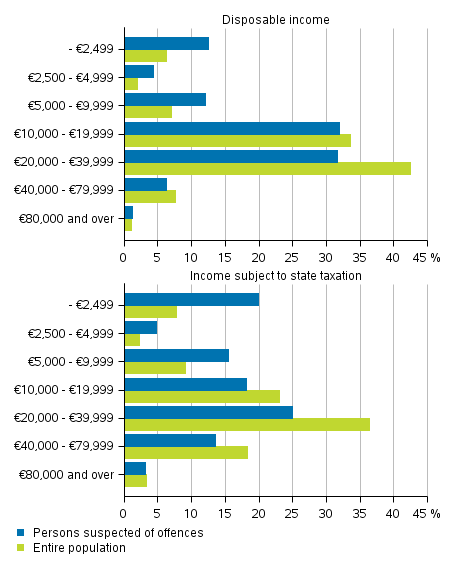
When viewed by disposable money income, the income level of those suspected of offences against the Penal Code was higher than based on income subject to state taxation. The median of the suspects' disposable income is 82 per cent of that of total population. With income subject to state taxation, the share is 66 per cent. Of the suspects, 16.9 per cent had an income of under EUR 5,000, while according to income subject to state taxation, this group included 24.7 per cent of the suspects. The respective figures for the whole population are 8.2 and 10.0 per cent. Disposable income of over EUR 20,000 was earned by 39.1 per cent of suspects and 51.1 per cent of total population. Disposable income = earned income + entrepreneurial income + property income + current transfers received - current transfers paid. Disposable income is a better measure than income subject to state taxation for describing the actual income of suspects.
Figure 10. Persons suspected of offences against the Criminal Code and the entire population by income subject to state taxation and disposable income in 2017, aged 15 years and over
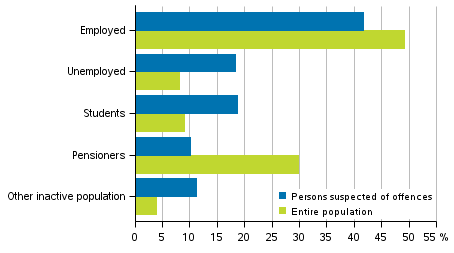
Classified by main type of activity, 41.7 per cent of the suspects of offences against the Penal Code (belonging to the registered population aged 15 or over) were employed persons. Of all suspects, 18.4 per cent were unemployed and 11.2 per cent in the inactive population. Of the whole population, 49.2 per cent were employed, 8.2 per cent unemployed and 3.9 per cent in the inactive population. The information on main type of activity is from 2015 so it may differ from the current situation.
Figure 11. Persons suspected of offences and the entire population by main activity in 2017, aged 15 and over
Of suspects of offences against the Penal Code aged 15 or over, 44.2 per cent had completed only basic level education and 41 per cent upper secondary education. The respective figures for the whole population were 29.2 and 40.3 per cent.
In Appendix tables 4 to 7, the same person can be a suspect several times. This is a common way to present the number of suspects of offences in the statistics. This produces a better view of criminality as a phenomenon and the backgrounds of the persons guilty of a particular offence can be described better.
2.4 Origin and foreign citizens
The number of persons suspected of offences against the Penal Code solved in 2017 by the police, customs and border guard was 297,800, of whom 33,500 were citizens of foreign countries. Compared to 2016, the number of all suspects of offences against the Penal Code decreased by 4.3 per cent, while the number of foreign citizens suspected went down by 0.7 per cent. The share of foreign nationals in all suspects of offences against the Penal Code was 11.2 per cent. One year earlier, the corresponding share was 10.8 per cent. The share of foreigners among suspects living permanently in Finland was 6.3 per cent. The share of foreign citizens in the population was 4.5 per cent. If we only examine those aged 15 to 49, the share of foreigners among suspects living permanently in Finland was 6.9 per cent. In the population, the share of foreign citizens among persons aged 15 to 49 was 7.2 per cent.
In 2017, Estonians (8,400) and Russians (5,000) made up the biggest group of foreign suspects of offences against the Penal Code. Of Estonian suspects, 53.3 per cent and 36.6 per cent of Russians had a permanent place of residence in Finland. Compared with the year before, the number of offences by Estonians decreased by 2.8 per cent and those by Russians increased by 11.3 per cent. Citizens of the former Soviet Union are also included in Russians.
Other countries where over 1,000 of its citizens were suspected were Iraq (3,250), Sweden (1,600), Romania (1,500) and Somalia (1,200). Of Romanians, only 15.8 per cent had a permanent place of residence in Finland. The respective shares for Somalis and Swedes were 94.7 and 62.1 per cent. The share of Iraqi suspects has doubled from 2014. There were 1,500 Iraqi suspects in 2014 and 87.8 per cent of them were living permanently in Finland. Of Iraqi suspects, 52.2 per cent had a permanent place of residence in Finland in 2017. One person can be guilty of many different offences during a year.
Figure 12. Foreign citizens suspected of offences against the Criminal Code by place of residence in Finland in 2009–2017
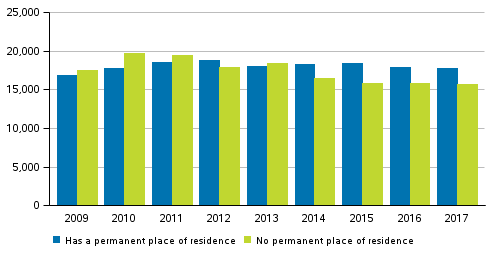
Among the offences against the Penal Code solved in 2017, altogether 53.1 per cent of the suspected foreign citizens were living permanently in Finland. The share is equal to that in 2016, but 0.7 percentage points smaller than in 2015. Typical offences by foreigners living in Finland were theft, assault and narcotics offences, as well as driving a motor vehicle without a licence.
In the statistics, the same person can be a suspect several times. Data on the nationality of suspects and on whether they are permanently resident in Finland are based on the nationality data derived from the police and those selected by means of the personal identity code from the population data. The group “no permanent place of residence in Finland” is in that sense problematic, because it may include persons staying longer periods in Finland without applying for a permanent place of residence here. The group may also include persons suspected of a narcotics offence, for example, who have come to Finland only for the purpose of committing a crime. The number of foreign nationals differs somewhat from the figures reported by the police because the police also reports the nationality of the suspect in cases where the investigation is still ongoing. Only solved offences are included in Statistics Finland's figures.
Table 8. Suspects of solved offences against the Criminal Code living in Finland by age and nationality in 2017
| Age group | Suspects living permanently in Finland | Share per 1,000 population in the age group | ||
| Finnish residents | Foreign citizens | Finnish residents | Foreign citizens | |
| Total | 262,451 | 17,768 | 49.9 | 71.2 |
| - 14 | 7,530 | 598 | 8.8 | 15.7 |
| 15 - 17 | 13,283 | 879 | 78.4 | 137.8 |
| 18 - 20 | 33,991 | 1,292 | 195.1 | 168.3 |
| 21 - 24 | 35,103 | 1,830 | 139.0 | 135.1 |
| 25 - 29 | 36,677 | 3,324 | 113.4 | 107.5 |
| 30 - 34 | 33,922 | 3,321 | 107.2 | 92.8 |
| 35 - 39 | 27,589 | 2,543 | 86.3 | 82.6 |
| 40 - 44 | 19,390 | 1,537 | 62.7 | 65.0 |
| 45 - 49 | 15,892 | 1,149 | 51.5 | 60.2 |
| 50 - 54 | 13,257 | 599 | 37.3 | 42.6 |
| 55 - 59 | 9,774 | 370 | 27.6 | 33.7 |
| 60 - 64 | 6,766 | 202 | 18.8 | 27.3 |
| 65 - 69 | 4,535 | 74 | 12.4 | 16.1 |
| 70+ | 4,742 | 50 | 5.9 | 7.6 |
Of the 126,100 persons suspected of offences against the Penal Code, 111,100 (88.2 per cent) were of Finnish background. There were 14,700 suspects with foreign background (11.7 per cent). The figures were calculated so that a person is a suspect only one time during the year, which means that this is not the "gross number" of suspects. In the whole population, 93.4 per cent are of Finnish background and 6.6 per cent of foreign background. Of suspects with Finnish background, 2,200 (two per cent) had been born abroad. Of suspects with foreign background, 92.8 per cent had been born abroad. In the review, included are persons belonging to the registered population, that is, people with a Finnish personal identity code. Data on origin are from 2016, so the data on origin of good one two hundred persons were unknown even though they had a Finnish personal identity code. Typically, these persons have moved to Finland in 2017.
Suspects born in Finland with Finnish background numbered 21.4 per 1,000 population with the same origin. Correspondingly, the figure for foreign-born suspects with Finnish background was 43.7. Good one-half of foreign-born persons with Finnish background were born in Sweden. The share of Finnish-born suspects with foreign background per 1,000 population was 18.3 per cent and that of foreign-born persons with foreign background was 44.4 per cent.
Table 9. Persons suspect of offences against the Criminal Code by origin and share per 1,000 population 2016-2017
| Origin | Suspected | Share per 1,000 population | ||
| 2016 | 2017 | 2016 | 2017 | |
| Origin total | 139,121 | 126,056 | 25.3 | 22.9 |
| Person with Finnish background total | 123,680 | 111,136 | 24.1 | 21.6 |
| Person with Finnish background born in Finland | 121,284 | 108,921 | 23.8 | 21.4 |
| Person with Finnish background born abroad | 2,396 | 2,215 | 47.3 | 43.7 |
| Person with foreign background total | 15,429 | 14,688 | 42.3 | 40.3 |
| Person with foreign background born in Finland | 972 | 1,063 | 16.8 | 18.3 |
| Person with foreign background born abroad | 14,457 | 13,625 | 47.1 | 44.4 |
| Origin unknown | 12 | 232 | . | . |
A person whose one or both parents were born in Finland is counted as having Finnish background. A person has foreign background if his or her both parents were born abroad. There are more of younger age groups and men among persons with foreign background compared with those with Finnish background. Among the population, 65 per cent of those with foreign background and 46 per cent of those with Finnish background are aged under 40.
More details about the origin of suspects by age group and sex is available in the appendix table. The figures are calculated so that one person is a suspect only one time. The figures calculated here differ from the figures presented elsewhere in this publication where the same person can be a suspect several times during a year.
If the number of suspects is calculated so that the same person can be a suspect of several offences against the Penal Code, the number of suspects with Finnish background was 255,800 (85.9 per cent of suspects). Of them, 247,600 were born in Finland and 8,200 abroad. Suspects with foreign background numbered 28,600 (9.6 per cent of suspects). Of persons with foreign background, 2,900 were born in Finland and 25,600 abroad. Among suspects, 0.1 per cent were of unknown origin and 13,200 (4.4 per cent) did not have population information. Population information is missing for tourists and those staying temporarily in the country, for example. Compared with 2016, the number of people with Finnish background among suspects decreased by 4.7 per cent and those with foreign background by 2.3 per cent. The share of Finnish-born suspects with foreign background increased by 18.2 per cent. The number of persons in the group "no population information" decreased by 1.5 per cent.
In 2017, a person was suspect of an average of 2.3 solved offences against the Penal Code. Persons with Finnish background born in Finland were suspects of 2.3 offences and persons with Finnish background born abroad of 3.7 offences. Of persons with foreign background, those born in Finland were suspects of 2.8 offences and those born abroad of 1.9 offences.
Source: Statistics on offences and coercive measures 2017, Offences reported. Statistics Finland
Inquiries: Kimmo Haapakangas 029 551 3252, rikos@stat.fi
Director in charge: Jari Tarkoma
Updated 8.5.2018
Official Statistics of Finland (OSF):
Statistics on offences and coercive measures [e-publication].
ISSN=2342-9178. Reported offences, 1st quarter 2017,
2. Persons suspected of solved offences and victims of offences
. Helsinki: Statistics Finland [referred: 18.7.2024].
Access method: http://www.stat.fi/til/rpk/2017/13/rpk_2017_13_2018-05-08_kat_002_en.html