

Published: 4 April 2014
Households' income development continued weak in 2012
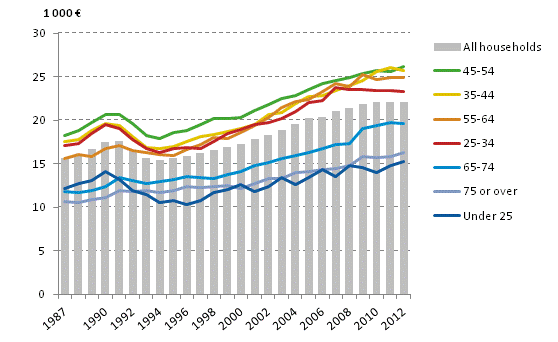
According to Statistics Finland's income distribution statistics, households' income development has been weak in recent years. In 2012, median income decreased by 0.2 per cent in real terms from the year before. In 2008 to 2012, the average annual change was only 0.8 per cent while the change in 2001 to 2008 was 2.7 per cent. The income level of the population aged 65 to 74 has increased towards the end of the past decade while the income of the population aged 25 to 34 has decreased from 2008.
Household's disposable monetary income per consumption unit by the age of the reference person in 1987 to 2012, median, in 2012 money
In 2012, households’ average disposable money income was around EUR 37,500 and the median income was EUR 31,300. Income refers to the monetary income after taxes and consists of earned income, property income, and other transfer income. The median for equivalent disposable monetary income was EUR 22,100 in 2012, which was 0.2 per cent lower than one year earlier 1) .
The income development has varied somewhat between population groups, in the past few years, relative income development has been best for economically inactive households, such as households of the unemployed and pensioners. The average annual change in income for unemployed households was nearly three per cent in 2008 to 2012. The corresponding change for pensioner households was around 2.5 per cent.
The good income development of pensioner households is also reflected in the examination by age group, as in 2008 to 2012, the average annual change in real income for households of those aged 65 to 74 was nearly three per cent. In households of those aged over 74, the corresponding annual change was around half a percentage point lower. The income of the youngest age group, households of those aged under 25, also grew nicely with an average annual change of 2.7 per cent. Even though the relative income changes were highest for economically inactive households, considering their low income level the annual changes measured in euro did not visibly improve their position.
The income development was poorest in the 25 to 34 age group, whose annual income change in 2008 to 2012 was one to two tenths negative, so the real income of the age group decreased. The annual growth of real income for employee households was zero in 2008 to 2012.
The income concept is equivalent disposable monetary income. The figures are based on an internationally comparable income concept that does not include imputed income items (such as income from owner-occupied dwellings) or sales profits. Comparison by households' population groups with different income concepts is possible with the help of the database tables of income distribution statistics.
1) The consumption units are based on the so-called OECD's modified scale. One adult in the household is one consumption unit. Other persons in the household aged at least 14 are 0.5 consumption units each and children aged 0 to 13 are 0.3 consumption units each. A household with one adult member is one consumption unit, while a household consisting of spouses and one child aged under 14 together are 1.8 consumption units. Equivalent income calculated by means of consumption units takes into account the size differences between households and enables their comparison with one another.
Source: Income Distribution Statistics 2012, Statistics Finland
Inquiries: Laura Lohikoski 09 1734 3396, Pekka Ruotsalainen 09 1734 2610
Director in charge: Riitta Harala
Publication in pdf-format (197.9 kB)
- Tables
-
Tables in databases
Pick the data you need into tables, view the data as graphs, or download the data for your use.
Updated 04.4.2014
Official Statistics of Finland (OSF):
Income distribution statistics [e-publication].
ISSN=1799-1331. Income differentials between population subgroups 2012. Helsinki: Statistics Finland [referred: 27.7.2024].
Access method: http://www.stat.fi/til/tjt/2012/03/tjt_2012_03_2014-04-04_tie_003_en.html