

Published: 14 December 2018
International trade in services continued growing in the third quarter of 2018
Service exports grew by five per cent in the third quarter of 2018 compared to the corresponding quarter last year. Service imports grew by eight per cent. Other business services were both sold and purchased more than in the third quarter of 2017, which most explains the growth in both service exports and imports. The data appear from Statistics Finland's statistics on international trade in goods and services, which are part of balance of payments .
Imports and exports of services
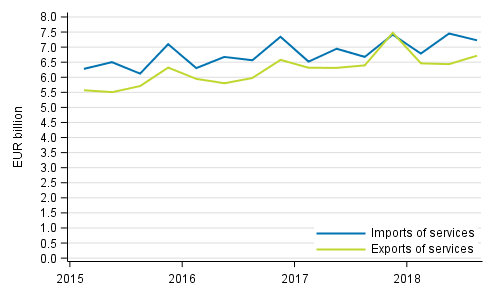
The combined exports of goods and services grew by three per cent and imports by eight per cent in the third quarter of 2018 compared with the corresponding quarter of the previous year. In balance of payments terms, goods exports also grew by three per cent and goods imports by eight per cent.
Goods exports in customs terms grew two percentage points more than in balance of payments terms. The weaker development of goods exports in balance of payments terms was due to the exceptionally high level in the third quarter of 2017. The level of goods exports in customs terms was lower in the period in question.
The levels in customs terms and in balance of payments terms can differ, because goods trade in customs terms includes flows of goods where ownership does not change. In contrast, goods trade in balance of payments terms is based on change of ownership. In addition to the changes made to the customs data, goods trade in balance of payments terms includes sales and purchases from aboard to abroad.
Growth in other business services
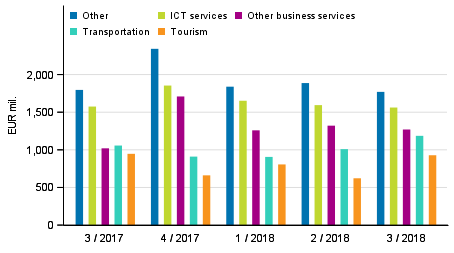
Other business services are the second biggest item of service exports after telecommunications, computer and information services (ICT). Exports of other business services grew by 25 per cent in the third quarter of 2018 compared to the third quarter of one year ago. Transport services were the third biggest item of exports and their exports grew by 12 per cent. Exports of telecommunication, computer and information services remained on level with the previous year’s third quarter.
Exports of other business services grew mostly on account of an increase of 42 per cent in the sub-item professional and management consulting services, which include such as legal services, accounting, auditing, bookkeeping and tax consultancy services, and advertising, market research and public opinion polling. Technical, trade-related and other business services, which are also a sub-item of other business services, grew by 15 per cent.
Exports of construction and project deliveries fell by 11 per cent, while imports went down by 14 per cent in the third quarter of 2018 compared to the corresponding quarter last year. Measured in euros, the fall in both imports and exports amounted to some EUR 60 million.
Service imports grew by eight per cent in the third quarter of 2018. Service imports grew particularly due to increased imports of other business services, telecommunications, computer and information services and transport.
Other business services were imported 15 per cent more than in the third quarter of 2017, while imports of telecommunications, computer and information services were up by 20 per cent. However, imports of other business services grew more in euros: by around EUR 0.3 billion, which was over two times more than the growth in telecommunications, computer and information services or in transport services. Imports of transport services increased by 10 per cent.
Imports also grew particularly in two sub-items of other business services: technical, trade-related and other business services and professional and management consulting services.
Exports of services by service item
Moderate changes by country in international trade
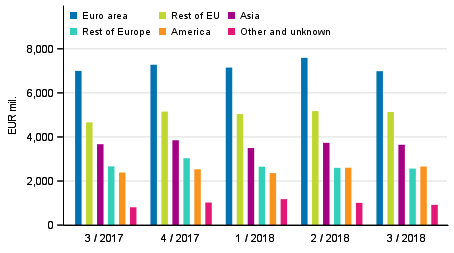
International trade in services was highest with Sweden, the United States, Germany and the United Kingdom in the third quarter of 2018. Sweden accounted for 14 per cent of service exports, the United States for 11 per cent. Nine per cent of Finland’s service exports were headed to Germany and four per cent to the United Kingdom in the third quarter of 2018.
Russia's share of service exports was one percentage point and China’s share two percentage points higher than that of the United Kingdom, but two times more services were imported from the United Kingdom than from Russia or China. The United Kingdom was the only trade partner where service exports fell among the countries mentioned above. The share of the United Kingdom in service exports decreased by one percentage point.
Exports to the United Kingdom were EUR 50 million lower than in the corresponding quarter of the previous year, which represents a fall of 16 per cent. Exports of services to the United Kingdom were thus only close on EUR 0.3 billion.
The shares of Sweden and Germany in international trade in services exports remained similar to the third quarter of 2017. Service exports to Sweden amounted to nearly EUR one billion and to the United States to close on EUR 0.8 billion. Exports of services to Germany were almost EUR 0.6 billion.
The share of the services exported to United States grew by one percentage point. Measured in euros, service exports to the United States grew by around EUR 90 million, 14 per cent.
The share of the services imported from the United States also grew by one percentage point and by around EUR 90 million. The growth was thus 23 per cent. Both more goods and services are still exported to the United States than imported from there.
Exports of goods and services in balance of payments terms by area
Statistics on international trade
The statistics on international trade in goods and services are part of balance of payments . The statistics comprise breakdowns of goods and services on a more detailed level. The guidelines and recommendations of the Balance of Payments Manual (BPM6) applied to balance of payments are consistent with the European System of Accounts (ESA 2010). National Accounts are published on the quarterly and annual levels. Finnish Customs publishes data on goods trade across borders. Goods trade published by Finnish Customs is used as source data for the statistics on international trade in goods and services. Removals and additions caused by definitions are made to them to achieve goods trade in balance of payments terms.
Finnish Customs’ statistical service, tilastot@tulli.fi, +358 29 552 335.
Source: International trade in goods and services 2018, Statistics Finland
Inquiries: Risto Sippola 029 551 3383, Terhi Tulonen 029 551 3604, globalisaatio.tilastot@stat.fi
Director in charge: Ville Vertanen
Publication in pdf-format (270.7 kB)
- Tables
-
Tables in databases
Pick the data you need into tables, view the data as graphs, or download the data for your use.
Appendix tables
- Revisions in these statistics
-
- Revisions in these statistics (14.12.2018)
Updated 14.12.2018
Official Statistics of Finland (OSF):
International trade in goods and services [e-publication].
ISSN=2343-4244. 3rd quarter 2018. Helsinki: Statistics Finland [referred: 19.7.2024].
Access method: http://www.stat.fi/til/tpulk/2018/03/tpulk_2018_03_2018-12-14_tie_001_en.html