

3 Working hours in 2016
3.1 Working hours have changed slowly
The concepts of working hours used in the statistics are usual weekly working hours, hours actually worked per week, and annual hours actually worked per employed.
Usual weekly working hours refer to an employed person’s normal or average weekly working hours in the main job. Regular paid or unpaid overtime is included in the usual weekly working hours of employees.
Hours actually worked per week are the number of hours employed persons have worked in the survey week. Hours actually worked per week are separately inquired as concerns the main job and secondary job. All paid or unpaid overtime hours during the survey week are also included. On the other hand, holidays, weekdays off and absences for other reasons (e.g. sickness) reduce the hours actually worked per week.
Annual hours actually worked per employed are an imputed concept, which is obtained by dividing the number of hours worked by all employed in main and secondary jobs during the year by the annual average number of employed. This produces the average annual hours actually worked per employed. The average annual hours actually worked per employed are calculated in the same way for employees.
Working hours and hours worked fluctuate according to changes in the employment and in the structure of the employee population. For instance, if part-time work becomes more widespread than full-time work, the average weekly working hours will decrease. Working hours also vary by industry and occupation, as well as by employer sector. Working hours change quite slowly.
3.2 Most common usual working week is 35 to 40 hours
The vast majority of employees, 71 per cent, had a usual week of 35 to 40 hours in 2016. Around ten per cent of employees had a usual week of over 40 hours. Nineteen per cent of employees had a usual week of under 35 hours. The most typical usual weekly working hours for those working a short week were 30 to 34 hours.
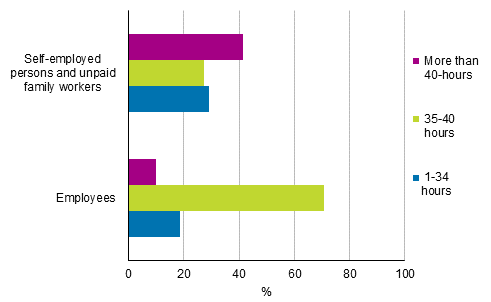
Long usual weekly working hours were clearly more widespread among self-employed persons and unpaid family workers. For 42 per cent of them, usual weekly working hours were over 40 hours. Only 27 per cent of self-employed persons and unpaid family workers had usual weekly working hours of 35 to 40. A short working time of under 35 weekly hours was more common for self-employed persons (29%) than employees (19%). (Figure 16.)
Figure 16. Average usual weekly working hours of employed persons in their main job by status in employment in 2016, persons aged 15 to 74, %
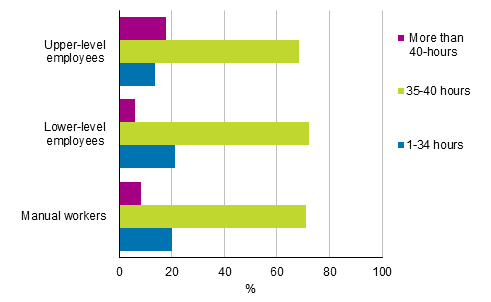
Differences between different employee groups in usual weekly working hours are most clearly visible in the share of those with long weekly working hours. For all groups, clearly the most common working hours were 35 to 40 hours per week, but 18 per cent of upper-level employees usually work over 40 hours per week, while the corresponding share among lower-level employees is six per cent. Around one in five lower-level employees and manual workers had short usual working hours of under 35 hours per week. Short usual weekly working hours were less usual among upper-level employees. (Figure 17.)
Figure 17. Average usual weekly working hours of employees in their main job by socio-economic group in 2016, persons aged 15 to 74, %
3.3 Men’s working week in full-time employment longer than women’s
In 2016, employees' average usual weekly working hours were 36.2 hours in their main job and their hours actually worked per week were 35.3 hours in their main job. Usual working hours remained unchanged from the year before, but hours actually worked lengthened on average by 18 minutes per week.
Working hours were considerably longer for self-employed persons (including unpaid family workers) than for employees: the average for usual weekly working hours was 39.8 hours per week and hours actually worked per week were, on average, 39.0 hours. Compared to usual weekly working hours, hours actually worked per week are reduced by holidays and other absences but on the other hand, are lengthened by worked overtime hours.
As in previous years, men's usual and actual weekly working hours were longer than women’s in 2016. By contrast, both the usual and actual weekly working hours of women working part-time were slightly longer than for men working part-time. (Table 2.)
Table 2. Average of employees' usual weekly working hours in their main job and hours actually worked per week in full-time and part-time work in their main job by sex in 2016, aged 15 to 74, %
| Usual weekly working hours, hours/week | Hours actually worked per week, hours/week | |||||
| Full-time and part-time work total | Full-time work | Part-time work | Full-time and part-time work total | Full-time work | Part-time work | |
| Sexes, total | 36.2 | 39.1 | 19.5 | 35.3 | 37.9 | 20.0 |
| Males | 38.0 | 40.0 | 18.7 | 37.1 | 39.0 | 19.0 |
| Females | 34.5 | 38.1 | 19.9 | 33.4 | 36.6 | 20.4 |
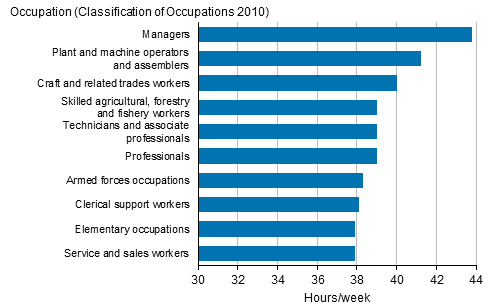
Among the occupational groups of employees in full-time employment, managers had the longest usual weekly working hours of 43.8 in 2016. In addition to managers, only plant and machine operators, and assemblers had usual weekly working hours of over 40. Correspondingly, service and sales workers had the shortest usual weekly working hours. (Figure 18.)
Figure 18. Average usual weekly working hours of full-time employees in their main job by occupation in 2016, persons aged 15 to 74, %
3.4 Annual hours actually worked per employee in the central government sector lengthened by 59 hours
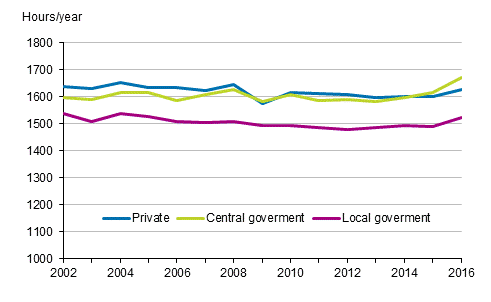
Annual hours actually worked per employee (see definition in Section 3.1) was 1,602 hours in 2016, which was 28 hours more than in the previous year. Annual hours actually worked per employee were last longer than this in 2008. As mentioned in Section 3.2, usual working hours did not grow, but annual hours actually worked per employed lengthened because secondary jobs and overtime work increased and absences from work declined.
In the private sector and in the central government sector, annual hours actually worked per employee have in the past few years been almost of the same size, but in 2016, annual hours actually worked per employee in the central government sector lengthened more than in the private sector. Central government sector employees worked an average of 1,672 hours in 2016, which is most throughout the 2000s. There was also growth in the private and local government sectors. (Figure 19.) The annual hours actually worked per employee in the local government sector has long been clearly shorter than in other sectors, which is connected to that there are clearly fewer employees in the local government sector working a long week of over 40 hours than in the private or central government sectors. The majority of the local government sector employees are women, and long working weeks are rarer among women than men.
In 2016, the number of annual hours actually worked per employee was 1,487 hours among female employees and 1,722 hours among male employees. Compared with 2015, men's annual hours actually worked lengthened by 37 hours and women's by 18 hours. The differences in men's and women's working hours is affected by that women's employment relationships are more often part-time than men's. Two-thirds of all employees working part-time are women. Family leaves also shorten women’s hours actually worked more than men’s.
Figure 19. Annual hours actually worked per employee by employer sector in 2002 to 2016, persons aged 15 to 74, %
Source: Labour Force Survey 2016. Statistics Finland
Inquiries: Hanna Sutela 029 551 2907, Liisa Larja 029 551 3461, tyovoimatutkimus@stat.fi
Director in charge: Jari Tarkoma
Updated 12.4.2017
Official Statistics of Finland (OSF):
Labour force survey [e-publication].
ISSN=1798-7857. Time series data 2007-2016 2016,
3 Working hours in 2016
. Helsinki: Statistics Finland [referred: 17.8.2024].
Access method: http://www.stat.fi/til/tyti/2016/13/tyti_2016_13_2017-04-12_kat_003_en.html