4 Inactive population
4.1 In all, 34.2 per cent of the population was in the inactive population in 2017
In 2017, there were 1,407,000 persons in the inactive population, or 34 per cent of persons aged 15 to 74. The number was 17,000 persons less than in 2016. In the Labour Force Survey, the inactive population refers to persons who were not employed or unemployed during the survey week. Persons performing compulsory military service also belong to the inactive population.
The Labour Force Survey collects data on what the persons in the inactive population see as their principal activity. A majority of them, or 61 per cent reported that they were on old-age or disability pension or chronically ill. Of the inactive population, 23 per cent reported that they were students or pupils. Five per cent were caring for their own children or some other relative.
4.2 Number of persons in disguised unemployment turned to decline
Persons in the inactive population who would want gainful work and would be available for work within a fortnight, but who have not looked for work actively in the past four weeks are considered persons in disguised unemployment in the Labour Force Survey. Persons in disguised unemployment can be considered as potential additional labour force.
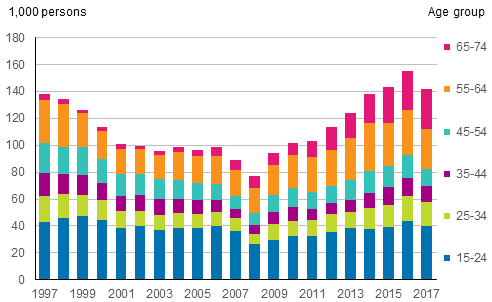
There were a total 143,000 persons aged 15 to 74 in disguised unemployment in 2017, which was 12,000 less than in the year before. The number of persons in disguised unemployment declined for the first time since 2008. (Figure 20)
The assumption that no work is available was the most common reason among persons in disguised unemployment for not seeking employment. This was believed by good one-quarter of persons in disguised unemployment. For close on one-fifth, the reason was studying.
In 2017, just like in previous years, most persons in disguised unemployment were found in the age group 15 to 24, in total 40,000 persons. In both age groups, 55 to 64 and 65 to 74, the number of persons in disguised unemployment was 30,000. In the former group, 40 per cent did not believe they would find a job. In the latter group, nearly one-half felt that they had retired completely.
Figure 20. Persons in disguised unemployment by age group in 1997 to 2017

4.3 Nine per cent of young people outside work and education
This Section describes persons aged 15 to 24 who are not employed and have not participated in any type of education in four weeks before the Survey and who are not performing compulsory military service either. Here, participation in education refers to both education leading to a qualification and participation in various types of courses.
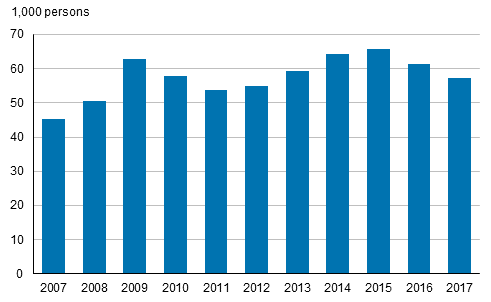
In 2017, there were a total of 57,000 young people not working, studying or performing compulsory military service, which represented nine per cent of the 15 to 24 age group. The share of young people outside work and education in the age group decreased slightly from 2016. A majority of them, 44,000, were aged between 20 and 24. Of young people outside work and education, 31,000 were men and 26,000 women. The number of young people not working, studying or performing compulsory military service has fluctuated somewhat in the past ten years (Figure 21).
Figure 21. Young people aged 15 to 24 that were not working, studying or performing compulsory military service in 2007 to 2017

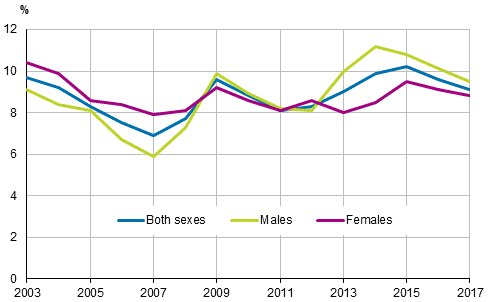
In the past five years, the share of young men not working, studying or performing compulsory military service has been higher than the corresponding share of women in the population of the same age. For men, the share has decreased since 2014 and for women since 2015. The share of those not working, studying or performing compulsory military service was, however, higher in 2017 than in 2011 and 2012.
Figure 22. Share of young people aged 15 to 24 not working, studying or performing compulsory military service of the population of the same age in 2003 to 2017, %

Source: Labour Force Survey 2017. Statistics Finland
Inquiries: Ulla Hannula 029 551 2924, Pertti Taskinen 029 551 2690, tyovoimatutkimus@stat.fi
Director in charge: Jari Tarkoma
Updated 12.4.2018
Official Statistics of Finland (OSF):
Labour force survey [e-publication].
ISSN=1798-7857. Employment and unemployment 2017,
4 Inactive population
. Helsinki: Statistics Finland [referred: 30.6.2024].
Access method: http://www.stat.fi/til/tyti/2017/13/tyti_2017_13_2018-04-12_kat_004_en.html

