

Published: 14 July 2021
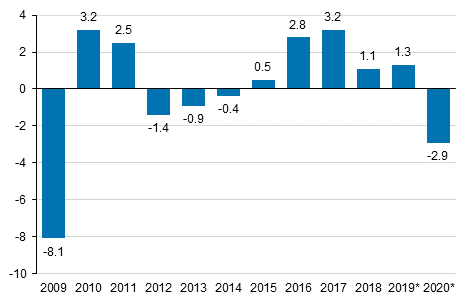
Gross domestic product fell by 2.9 per cent in 2020
According to Statistics Finland’s preliminary data, the volume of Finland’s GDP fell by 2.9 per cent in 2020. The fall was slightly revised from the initial preliminary data from March, where it was 2.8 per cent. The effects of the corona crisis varied between industries. Some of the largest declines concerned the accommodation and food services service industry and transportation.
Annual change in the volume of gross domestic product, per cent
Supply
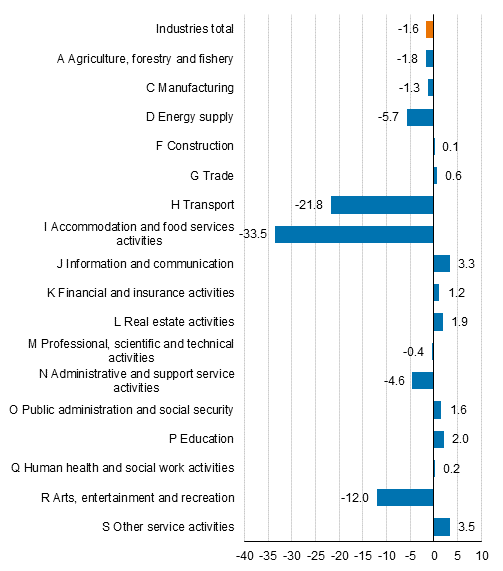
Value Added in the Service industry in clear decline - Manufacturing also down from last year
The value added to the whole economy at current prices fell by 1.6 per cent and volume by three per cent in 2020. The coronavirus had a particular effect on demand for services and in 2020, the current priced value added of service industries decreased by 1.9 per cent. The volume of service fell by 3.6 per cent. The variation between service industries was great. Some services experienced sharp drops in value added, like accomodation and catering, transport, arts, as well as entertainment and recreation.
Value added grew in the information and communication industry. Value added at current prices was growing slightly in many industries but the growth remained lower than normal.
Among manufacturing industries, the electronic and electrical industry grew clearly in 2020. Overall, value added in manufacturing at current prices declined by 1.3 per cent from the year before.
Change in value added at current prices in 2020, per cent
Demand
Household consumption expenditure fell clearly
Data on household consumption expenditure were published now in summer on a detailed level by consumption category, which provides further information about the structure of private consumption in 2020. At this stage, the data are still preliminary and they involve uncertainty particularly on the detailed level.
Similarly to value added, household consumption expenditure also shows exceptionally large variations by consumption category in 2020. The consumption expenditure of Finnish households abroad, as well as that of non-resident households in Finland, remained at unusually low levels.
In addition, exceptional decreases were seen in the consumption expenditure of culture and recreation and clothing, for example. Consumption expenditure on transport was also falling heavily, as was consumption expenditure on accommodation and food service activities.
Growth in private consumption was seen especially in food, alcoholic beverages, and domestic appliances and furniture.
Household consumption expenditure by consumption type is available in the database table 127s Household Final Consumption Expenditure annually.
Investments in slight decline
The current priced value of investments was EUR 57 billion in 2020. The volume of investments fell by one per cent.
The volume of private investments went down by three per cent. Investments in machinery and equipment decreased by five per cent. Investments in buildings and structures, as well as in intellectual property products also decreased from 2019.
The volume of public investments increased by 11 per cent. Measured in euros, the biggest growth was seen in civil engineering.
General government deficit grew by over EUR ten billion
The financial position, or net lending, of general government showed a deficit of EUR 12.8 billion. In the previous year, the deficit was EUR 2.3 billion. The data became slightly revised from the release of the national accounts in March. General government deficit was boosted in 2020 by expenditure related to the corona pandemic and the decrease in the accrual of tax revenue and social security contributions, the main individual items of which were reductions in corporation taxes and employment pension contributions. In 2020, the deficit was 5.4 per cent relative to GDP.
General government net lending (+) or net borrowing (-), EUR million relative to GDP (%)
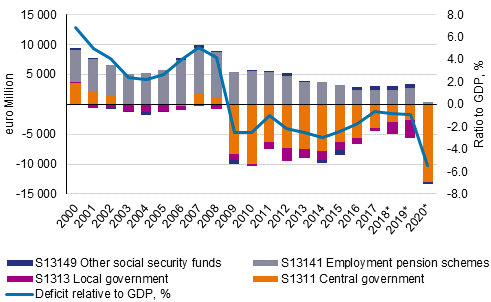
The deficit of central government was EUR 13.1 billion, while one year before it was EUR 2.6 billion. According to preliminary data, local government (municipalities and joint municipal authorities, etc.) was in surplus after a long time,by EUR 45 million. Central government contributed to the costs of the corona pandemic in local government and the deficit of local government turned into surplus as central government transfers to local government grew.
The surplus of employment pension schemes contracted considerably as dividend income and received social security contributions decreased, to around EUR 373 million. The surplus does not include holding gains in assets. The financial position of other social security funds also weakened, being EUR 201 million in deficit.
In this calculation round, the calculation method by which other subsidies on production received are allocated to industries and sectors was reviewed. For the time being the review affects only data for 2020, so there is a break in the time series for these figures between 2019 and 2020. Other subsidies on production cover a large number of different business subsidies, part of which were corona-related support in 2020.
Wages and salaries sum of the whole economy and number of employed persons fell
The wages and salaries sum of the whole economy fell by 0.4 per cent in 2020. The number of employed persons went down by 2.1 per cent and that of hours worked by three per cent.
The development of the wages and salaries sum and employed persons varied greatly by industry. The most negatively affected by the corona pandemic in terms of wages of salaries were the industries of transport and accommodation and food services. in addition to the aforementioned industries, industries where employed persons and working hours diminished strongly also included gambling and betting services, travel agencies and employment activities.
There was also industry-specific positive development in the number of employed persons. For instance, the development of IT-services and energy supply generated growth in the number of employed persons in 2020.
Examined by sector, wages and salaries in the non-financial corporations sector went down by 1.2 per cent, but wages and salaries in general government grew by two per cent.
Employers’ social security contributions fell due to the temporary relief made to them.
Revision of quarterly national accounts
In connection with the July release, we have also updated the database tables of quarterly national accounts in accordance with the European revision policy. The database tables have also been updated in the statistics on quarterly sector accounts and on general government revenue and expenditure by quarter.
Source: National Accounts 2020, Second preliminary data. Statistics Finland
Inquiries: Tapio Kuusisto 029 551 3318, Jarkko Kaunisto 029 551 3551, kansantalous@stat.fi
Head of Department in charge: Katri Kaaja
Publication in pdf-format (299.9 kB)
- Tables
-
Tables in databases
Pick the data you need into tables, view the data as graphs, or download the data for your use.
Appendix tables
- Revisions in these statistics
-
- Revisions on these statistics (14.7.2021)
Updated 14.7.2021
Official Statistics of Finland (OSF):
Annual national accounts [e-publication].
ISSN=1798-0623. 2020. Helsinki: Statistics Finland [referred: 18.7.2024].
Access method: http://www.stat.fi/til/vtp/2020/vtp_2020_2021-07-14_tie_001_en.html