News 7 Feb 2020
Labour Force Survey 60 years: statistics on labour force develop as society changes
Statistics Finland's Labour Force Survey has collected information on the activity, employment and unemployment of the working-age population starting from 1959. At the beginning, information was produced with relatively simple divisions, such as self-employed/employees. As Finnish society changes, information needs have also increased and diversified. We have responded to the change by developing the production of statistics. In the 2000s, the Labour Force Survey has collected information on the numbers of grant recipients, freelancers, temporary agency workers and platform economy workers.
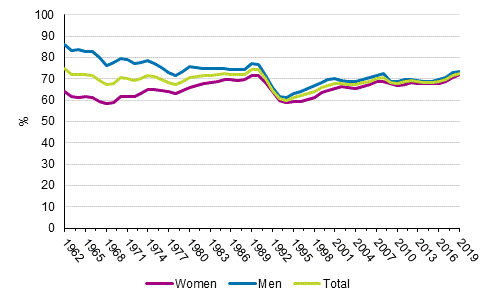
The time series of the Labour Force Survey describe changes in Finnish society at best for 60 years. For example, the employment rate for those aged 15 to 64 was only a few percentage points higher in 1962 than in 2019, but the structure of employment was quite different. At the time, the industries of agriculture, secondary production and services each employed around one third of employed persons in Finland. Now the service sector employs three times as many people as agriculture and secondary production put together. At the same time as women's labour force participation has become more common, men's employment rate has fallen.
Employment rates by sex in 1962 to 2019, persons aged 15 to 64, %
Labour Force Survey

The share of the inactive population among persons aged 15 to 74 has not much changed in 60 years, but the main type of activity of the inactive population has changed much more. While in the mid-1960s every fourth woman aged 15 to 74 said they were looking after their own households, caring for children or relatives was the main type of activity for just three per cent of women in the age group in 2019. The share of persons retired on account of age or disability among working-age people has, in turn, grown in 60 years from around 14 to 21 per cent.
Although the number of students has also increased strongly in Finland – first when the large age groups were educated at the turn of the 1960s and 1970s and further after that – the change has not significantly lowered the supply of labour. Many students have worked or sought work besides studies and have thus been classified in the labour force statistics as employed or unemployed.
In 1959, nearly 40 per cent of employed persons were self-employed persons or unpaid family workers, and most of them gained their living from agriculture and forestry. As a result of urbanisation, the number of employees rose fast so that in 1979 only every tenth employed person was a farmer and forestry entrepreneur in the statistics and around six per cent some other self-employed person.
After the end of the 1970s, the share of self-employed among all employed persons aged 15 to 64 has fallen by only a few percentage points. However, the structure of self-employed persons has changed radically. In 2019, just two per cent of employed persons in the age group worked as farmers. Three per cent of employed persons were employer entrepreneurs in other industries than agriculture and forestry. The share of sole entrepreneurs has risen in the 2000s gradually to seven per cent of employed persons.
The long time series of the Labour Force Survey tell the story of Finland: how a predominantly agricultural country was industrialised and became service-dominated, women entered the labour market and the expansion of the welfare state made both studying possible and secured livelihood in old age. This story still continues with the statistical release of the Labour Force Survey appearing every month.
Further information:
Hanna Sutela +358 29 551 2907, Anna Pärnänen +358 29 551 3795
