

Published: 21 June 2017
Exports of services growing in the first quarter of 2017
Exports of services grew by four per cent in the first quarter of 2017 when compared with the corresponding quarter one year previously. Imports of services increased by five per cent. Exports of services were boosted by tourism, transport, and construction and project deliveries. By contrast, exports of telecommunications, computer and information services continued to decline. The data appear from Statistics Finland's statistics on international trade in goods and services.
Imports and exports of services
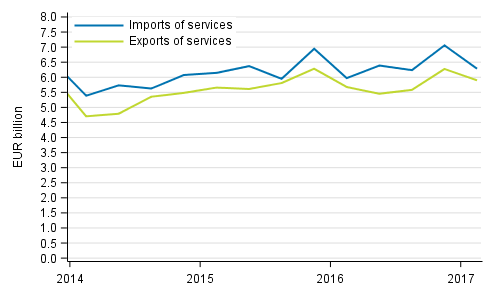
The combined exports of goods and services grew by 15 per cent and imports by 10 per cent in the first quarter of 2017 compared with the corresponding quarter in 2016. Exports of goods in balance of payment terms grew by 20 per cent and imports of goods by 13 per cent.
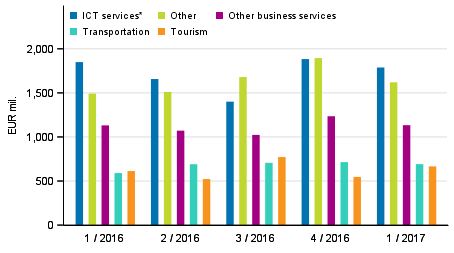
International trade in services by service item
The biggest individual item in exports, telecommunication, computer and information services*, continued declining. In the first quarter of 2017, it contracted by three per cent from the first quarter of 2016. Technical, trade-related and other business services also decreased in exports in the reference period.
Measured in percentages, transport, as well as construction and project deliveries grew most among export service items. Transport increased by 17 per cent, while construction and project deliveries grew by 16 per cent when comparing the first quarters of 2016 and 2017. Tourism receipts from abroad to Finland grew by nine per cent.
Imports of telecommunication, computer and information services grew by 12 per cent. Both other business services and tourism expenditure from Finland to abroad remained on level with twelve months ago. Other business services is the largest service item in imports with a 31 per cent share.
Exports of services by service item
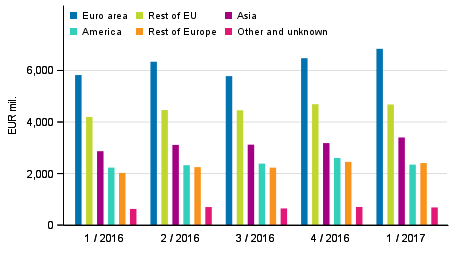
International trade by area
Slightly over 68 per cent of total exports were directed at Europe in the first quarter of 2017. Nearly one-half of this was directed at the euro area. The shares of different areas in total exports and imports of goods and services have mostly remained unchanged in the first quarter of 2017 compared to the corresponding period in 2016.
Europe’s share in total imports of goods and services was 83 per cent in the first quarter of the year. The euro area accounted for around 50 per cent of this. Total imports from Russia increased by 65 per cent in the first quarter compared with 2016. Thus, the share of Russia in total imports grew by around three percentage points in the reference period in question. Service imports from the UK grew by 14 per cent from one year ago but goods imports from the UK declined by six per cent. The share of service exports or goods imports to and from the UK did not change, however.
Exports of goods and services in balance of payment terms by area
Statistics on international trade
The statistics on international trade in goods and services are part of balance of payments . The statistics comprise breakdowns of goods and services on a more detailed level. The guidelines and recommendations of the Balance of Payments Manual (BPM6) applied to balance of payments are consistent with the European System of Accounts (ESA 2010). National Accounts are published on quarterly and annual levels . Finnish Customs publishes data on trade of goods across borders. The trade of goods published by Finnish Customs is used as source data for the statistics on international trade in goods and services. Removals and additions caused by definitions are made to them to achieve goods trade in balance of payments terms.
Finnish Customs’ statistical service, tilastot@tulli.fi, +358 29 552 335.
Source: International trade in goods and services 2017, Statistics Finland
Inquiries: Risto Sippola 029 551 3383, Terhi Tulonen 029 551 3604, globalisaatio.tilastot@stat.fi
Director in charge: Ville Vertanen
Publication in pdf-format (262.6 kB)
- Tables
-
Tables in databases
Pick the data you need into tables, view the data as graphs, or download the data for your use.
Appendix tables
- Revisions in these statistics
-
- Revisions in these statistics (21.6.2017)
Updated 21.6.2017
Official Statistics of Finland (OSF):
International trade in goods and services [e-publication].
ISSN=2343-4244. 1st quarter 2017. Helsinki: Statistics Finland [referred: 17.8.2024].
Access method: http://www.stat.fi/til/tpulk/2017/01/tpulk_2017_01_2017-06-21_tie_001_en.html