

Published: 22 March 2012
Total energy consumption fell by 5 per cent in 2011
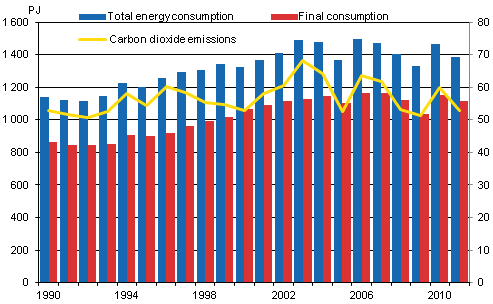
According to Statistics Finland’s preliminary data, total energy consumption amounted to 1,386 PJ (petajoule), or 386 TWh in 2011, which was over five per cent less than in 2010. Consumption of elec-tricity amounted to 84.4 TWh, down by 3.8 per cent from the year before. Energy consumption de-creased most in manufacturing and space heating of buildings due to fallen manufacturing output and the mild weather towards the end of 2011. Net imports of electricity into Finland increased by nearly 32 per cent, partly due to the good hydropower situation in the Nordic Countries. Carbon dioxide emis-sions from the production and use of energy diminished by over 11 per cent because 11 per cent less fossil fuels and eight per cent less peat were used. The use of renewable energy fell by three per cent. According to preliminary data for 2011, renewable energy accounted for under 28 per cent of total en-ergy consumption.
Total energy consumption, final consumption and carbon dioxide emissions
Among individual energy sources, the largest reduction of 21 per cent (39 PJ) was seen in the con-sumption of coal, while the second largest reduction of over five per cent (19 PJ) was recorded in the consumption of oil. The consumption of natural gas decreased by 10 per cent (15 PJ). Net imports of electricity grew by 12 PJ, or by some 32 per cent, and the consumption of nuclear energy by 4 PJ, or by nearly two per cent. The production of wind power grew by 64 per cent (0.7 PJ). The share of wind power amounts to 0.1 per cent of total energy consumption. Over one-fifth of Finland’s total energy consumption was covered by wood fuels. According to preliminary calculations, the use of wood fuels diminished by over three per cent, due to reduced use of spent liquor from the forest industry and de-creased need for space heating.
Final consumption of energy decreased by three per cent. According to preliminary data, the share of manufacturing of the final consumption of energy was 47 per cent, which was half-a-per cent lower than in 2010. The share of space heating of buildings, which decreased by 10 per cent in 2011, is just under one-quarter of the final consumption of energy. The share of energy use in transport stayed on level with the previous year. Sixteen per cent of the electricity consumed in Finland was covered with imported electricity. Domestic production of electricity decreased by nearly nine per cent. The produc-tion of condensate power decreased by 32 per cent, partly due to improved supply of hydropower in Sweden and Norway, and increased output of Swedish nuclear power plants. Combined heat and power production diminished by almost eight per cent. Combined heat and power production increased by seven per cent in industry’s combined power plants, but decreased by over sixteen per cent in district heating plants. Three per cent less electricity than in the year before was produced with hydropower in Finland. Since last summer, exports of electricity from Finland to the Nordic market have turned to net imports.
Diverse energy products were imported into Finland to the value of EUR 13.5 billion in 2011, which was 37 per cent up on 2010. Correspondingly, energy products were exported from Finland to the value of EUR 5.5 billion, which was 29 per cent up on the year before. More of almost all energy products were imported into Finland also in terms of volume. Stocks of coal in December were around 35 TWh, or over 40 per cent up on one year earlier. Stocks of peat amounted to around 11 TWh in December, or some six per cent down on the year before.
Total energy consumption by source (TJ) and CO2 emissions (Mt)
| Energy source 4) | 2011* | Annual change-%* | Percentage share of total energy consumption* |
| Oil | 334,046 | -5 | 24 |
| Coal 1) | 149,902 | -20 | 11 |
| Natural gas | 133,803 | -10 | 10 |
| Nuclear Energy 2) | 243,029 | 2 | 18 |
| Net Imports of Electricity 3) | 49,863 | 32 | 4 |
| Hydro and Wind Power 3) | 46,039 | -2 | 3 |
| Peat | 87,320 | -8 | 6 |
| Wood fuels | 308,900 | -3 | 22 |
| Others | 35,796 | 0 | 3 |
| TOTAL ENERGY CONSUMPTION | 1,388,698 | -5 | 100 |
| Bunkers | 35,088 | 12 | . |
| CO2 emissions from energy sector | 53 | -11 | . |
2) Conversion of electricity generation into fuel units: Nuclear power: 10.91 TJ/GWh (33% total efficiency)
3) Conversion of electricity generation into fuel units: Hydro power, wind power and net imports of electricity: 3.6 TJ/GWh (100%)
4) *Preliminary
Source: Statistics Finland, Energy supply and consumption
Inquiries: Pentti Wanhatalo 09 1734 2685, energia@stat.fi
Director in charge: Leena Storg�rds
Publication in pdf-format (457.5 kB)
- Tables
-
Tables in databases
Pick the data you need into tables, view the data as graphs, or download the data for your use.
- Figures
-
- Appendix figure 1. Changes in GDP, Final energy consumption and electricity consumption (22.3.2012)
- Appendix figure 2. Carbon dioxide emissions from fossil fuels and peat use (22.3.2012)
- Appendix figure 3. Coal consumption (22.3.2012)
- Appendix figure 4. Consumption of natural gas (22.3.2012)
- Appendix figure 5. Peat consumption (22.3.2012)
- Appendix figure 6. Domestic oil deliveries (22.3.2012)
- Appendix figure 7. Total Energy Consumption 2011* (22.3.2012)
- Appendix figure 8. Total Energy Consumption 1975 - 2011* (22.3.2012)
- Appendix figure 9. Fossil fuels and renewables 1970 - 2011* (22.3.2012)
- Appendix figure 10. Electricity supply 1970 - 2011* (22.3.2012)
- Appendix figure 11. Energy and electricity intensity 1970 - 2011* (22.3.2012)
- Appendix figure 12. Imports and exports of electricity 1990 - 2011* (22.3.2012)
- Appendix figure 13. Share of renewables of total primary energy 2011* (22.3.2012)
- Appendix figure 14. Final energy consumption by sector 2011* (22.3.2012)
- Appendix figure 15. Final energy consumption by sector 2010 and 2011* (22.3.2012)
- Appendix figure 16. Total energy consumption and final energy consumption 1970 - 2011* (22.3.2012)
- Appendix figure 17. Electricity supply 2010 - 2011* (22.3.2012)
- Appendix figure 18. Production of district heat 1970 - 2011* (22.3.2012)
- Appendix figure 19. Electricity generation capacity in peak load period In the beginning of the year 2011 (22.3.2012)
- Appendix figure 20. Electricity consumption by sector 1970 - 2011* (22.3.2012)
- Appendix figure 21. Renewable energy as a proportion of final energy consumption in 2009, and the target for 2020 (22.3.2012)
- Appendix figure 22. Electricity consumption by sector 2011* (22.3.2012)
- Appendix figure 23. Finlands greenhouse gas emissions 1990 - 2011* (22.3.2012)
Updated 22.3.2012
Official Statistics of Finland (OSF):
Energy supply and consumption [e-publication].
ISSN=1799-7976. 4th quarter 2011. Helsinki: Statistics Finland [referred: 27.7.2024].
Access method: http://www.stat.fi/til/ehk/2011/04/ehk_2011_04_2012-03-22_tie_001_en.html